How Nielsen Ratings Worked in the 1980s
The diaries, the little boxes, the mysterious slash, and the audience estimates that helped decide what came back next fall.
Ratings, shares and the people in the room. The numbers made more sense once you knew what they counted.

The show was gone, and somebody in the room wanted to know who had been consulted. Certainly not this household. This household had watched faithfully, argued through the commercials, and remembered the theme music better than several things expected on Friday’s spelling test. Now the newspaper said the ratings were bad. Apparently a group of strangers with special equipment had overruled the couch.
Nielsen occupied an odd place in eighties television conversation. Most viewers never saw a ratings meter, never filled out a diary, and never met anyone willing to admit that they had. Yet the company’s name appeared whenever adults discussed a hit, a flop, a time-slot change, or a favorite program’s suspicious disappearance. The numbers sounded authoritative even when nobody could explain the two figures separated by a slash.
That slash was doing more work than it looked like. An 18 rating and a 30 share could describe the very same audience. Meanwhile, one crowded couch still counted as one household, and a giant farewell episode didn’t automatically make its series the season champion. Once those pieces click, the numbers behind eighties television start making sense. Nobody has to take a statistics exam before the next commercial.
The equipment changed during the decade, too. The people meter belongs to the late eighties, not to every evening since the first family brought home a color set. Before and alongside it, electronic set measurements and handwritten viewing records did different jobs. Television’s apparently solid national scoreboard rested on a surprisingly human arrangement: selected households, machines that needed to work, and people who had to remember what they had done.
Inside This Article
- The numbers arrived after everybody else went to bed
- A rating counted the homes that could have watched
- A share counted the homes already using television
- A percentage gain was not the same as extra points
- Three people on one couch were still one household
- The audience was estimated from a sample
- The set meter knew where the dial had landed
- The diary asked people to remember the evening
- Your station’s audience was not the whole country
- Sweeps gave the calendar a sales department
- Advertisers wanted to know who had stayed
- An overnight was an early report, not an eternal verdict
- The television season did not observe New Year’s Eve
- A season rank and a giant farewell told different stories
- The commercial break was the reason for the spreadsheet
- Scheduling tried to keep the room from wandering
- Cable made the old three-way argument less complete
- A tape could preserve the show and complicate the count
- In 1987, the people meter asked who was in the room
- The new machines did not make the arguments disappear
- The same broadcasts could produce several columns
- Children could watch without helping the new button
- A trade advertisement wanted you to admire its category
- A rank put the audience in order, not into your head
- Read the label before arguing with the number
- The room was always more complicated than the report
- A few ratings questions before the next commercial
The numbers arrived after everybody else went to bed
The evening’s television ended in ordinary ways. Someone turned the knob, pressed the remote, or left the set talking to an empty room while looking for the dog. Elsewhere, the evening was becoming information. Stations and networks wanted to know which programs had held an audience, where viewers had moved, and whether the expensive new attraction had attracted enough of them.
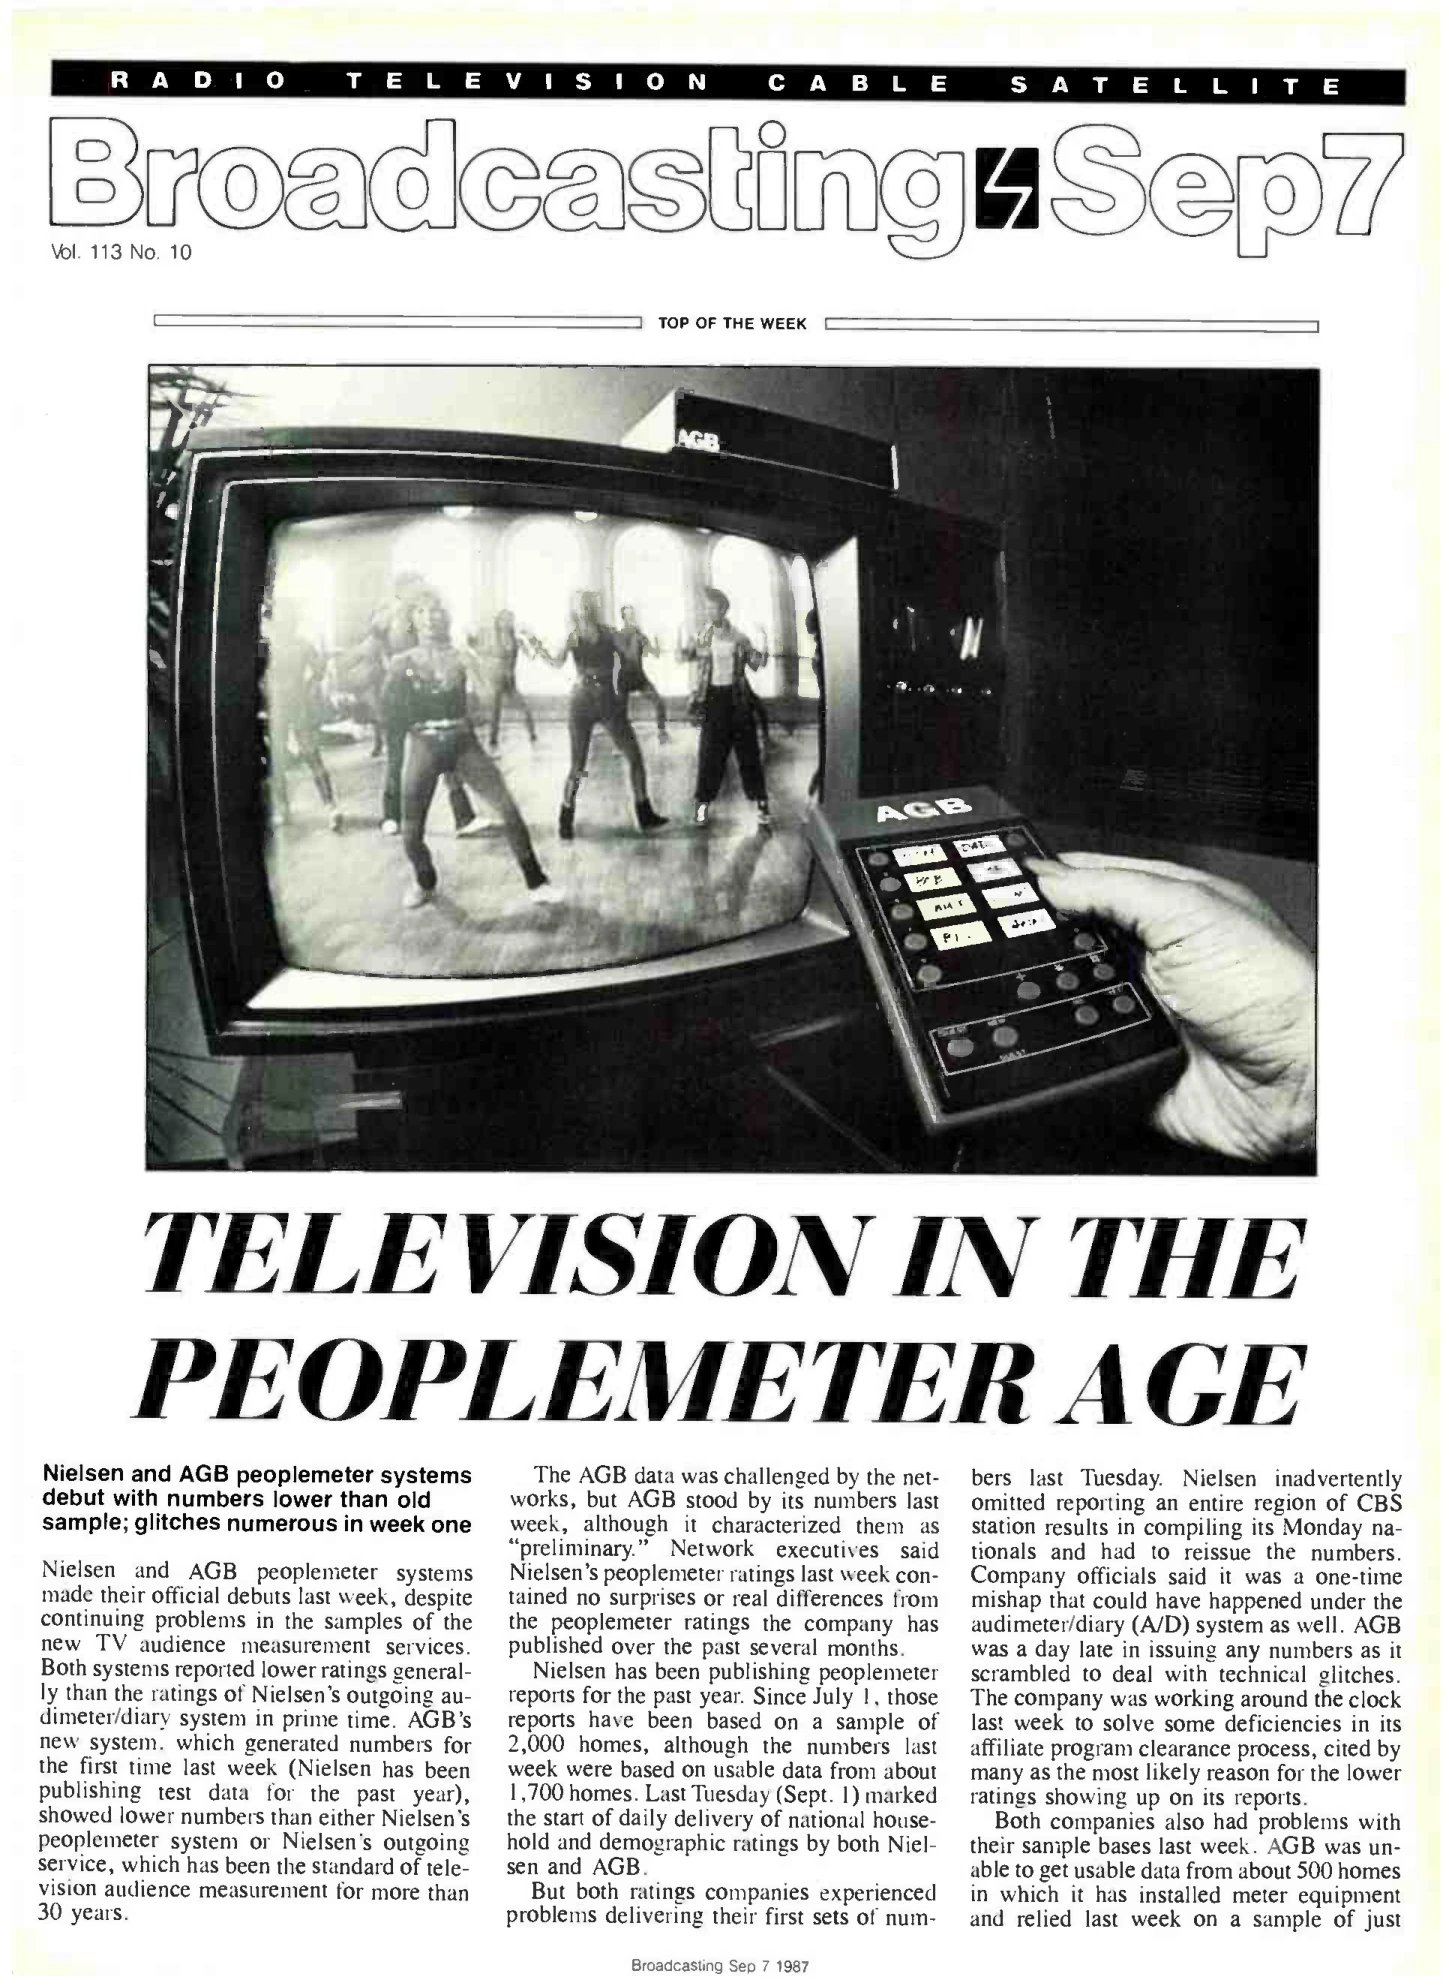
For the family, watching was an activity. For the commercial television business, it also produced something that could be sold: an estimated opportunity for advertisers to reach people. The program brought viewers together; the commercial break gave a buyer access to them. That is why audience research sat so close to decisions about which familiar people would be back on the screen next fall.
Nielsen did not need to learn whether every viewer had enjoyed the episode. A person could dislike a show and still watch the whole thing. Another could love it and be away that evening. Ratings concerned measured viewing, within a specified system and period. Approval, affection, artistic quality, and the likelihood of quoting a line at school were separate questions.
That difference explains a lot of childhood indignation. Your favorite could be excellent company and still lose its place in a commercial schedule. Conversely, a program you considered unbearable could be doing an extremely good job of gathering the audience its network wanted. The set had no obligation to reward your taste. It was already busy selling the next thirty seconds.
A rating counted the homes that could have watched
A household rating expresses the estimated audience as a percentage of the television-household universe being measured. The important word is household. One rating point means one percent of that defined universe, not one million people and not one percent of the sets currently switched on.
Try a deliberately small example. Imagine a country containing exactly 100 television homes. Eighteen homes watch a particular program. Its household rating is 18. The other 82 homes include people watching other things and people doing something entirely different. The denominator includes all 100 television homes, whether their sets are on or off.
Real national measurement worked with an estimated universe much larger than our imaginary neighborhood, and that universe changed over time. If the number of television homes grows, the number of homes represented by a rating point grows with it. A point from one season should not be assigned a permanent household headcount and carried through the decade like an unchanging exchange rate.
That is why an old newspaper’s percentage can remain useful even when a remembered audience total becomes muddled. First establish the unit and the year. Then look for the corresponding universe estimate or the published household total. The arithmetic itself is friendly. The trouble starts when a perfectly clear household percentage is quietly relabeled as millions of individual human beings.
A share counted the homes already using television
Now return to those 100 imaginary homes. Only 60 have television in use during our example period. The same 18 watch the program. Divide 18 by 60 and the household share is 30 percent. The program has an 18 rating and a 30 share. Both figures describe the same audience; they answer different questions.
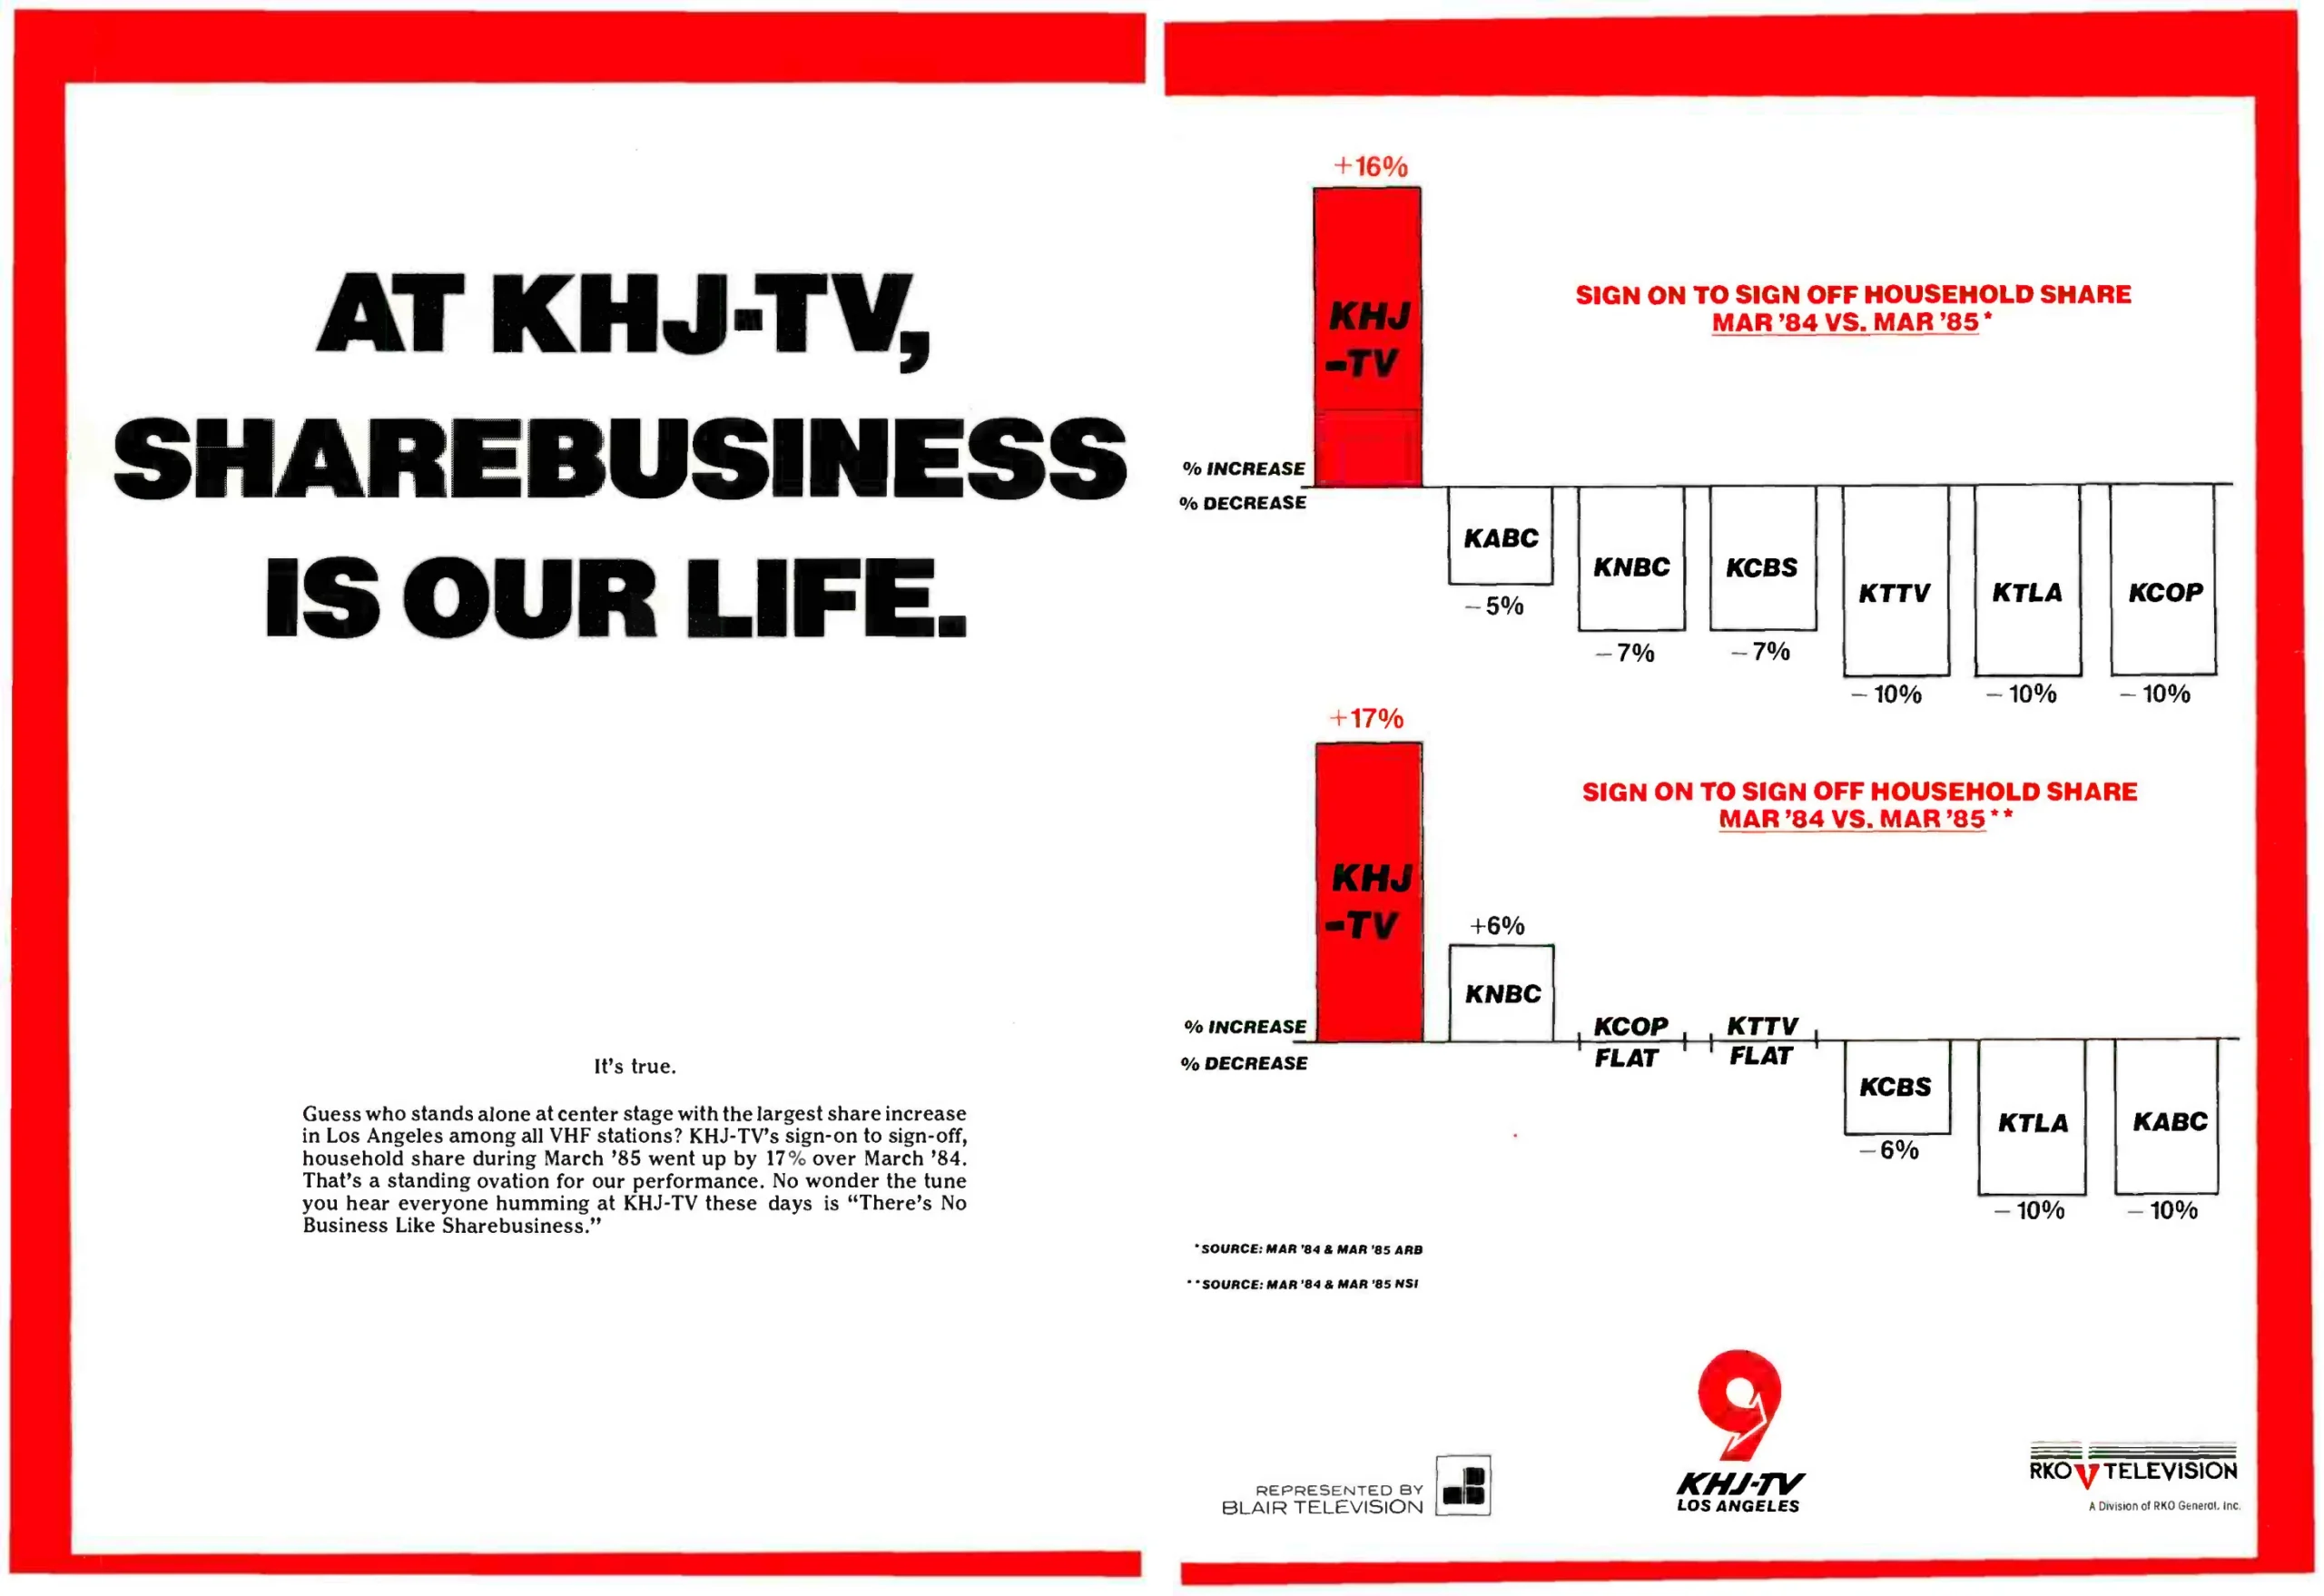
A rating asks how much of the whole television-household universe the program reached on the specified average basis. A share asks how much of the television being used at that time belonged to the program. Thirty share does not mean thirty percent of every home in America. Some homes are absent from that denominator because they are not using television.
A late-night program can therefore command an impressive share of a smaller active audience. The house that has gone to bed cannot help the rating, but it is not competing in the share calculation either. An evening with unusually heavy television use presents a different situation. More homes are available, and the same share can represent a larger audience.
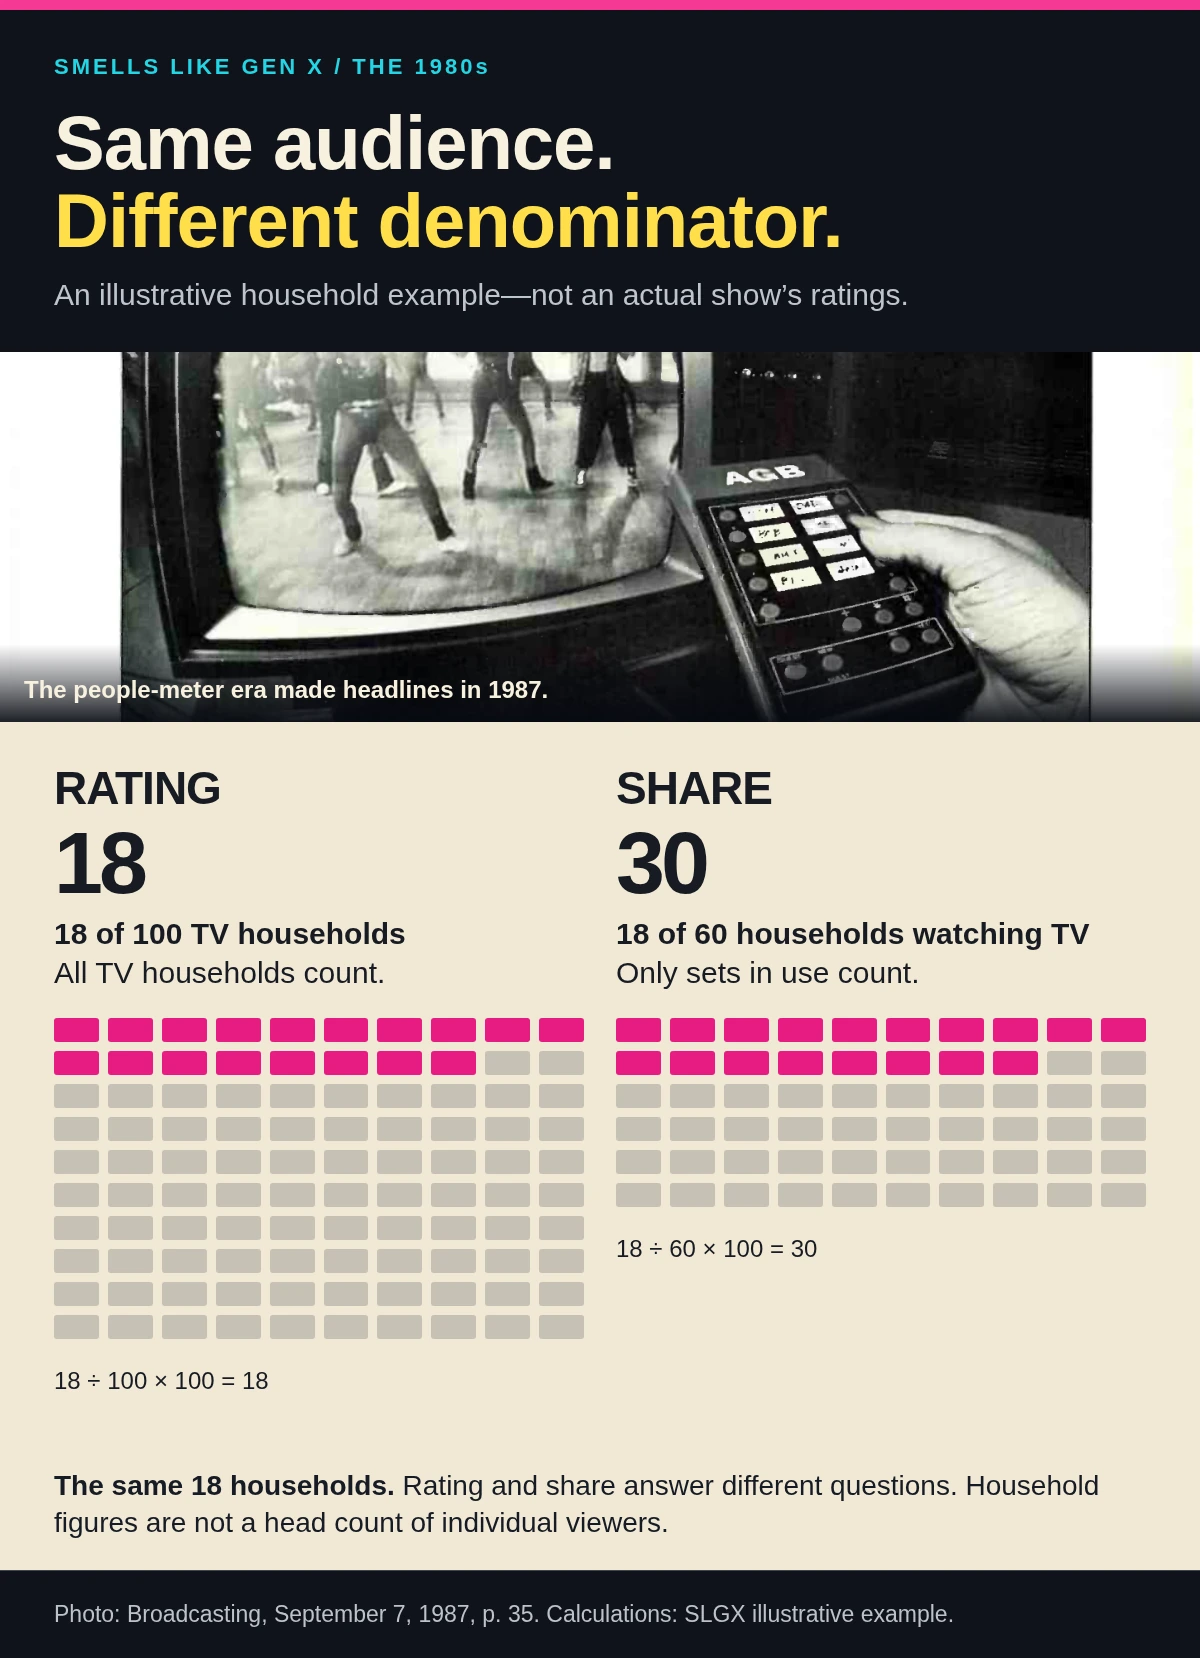
Stations understood the sales possibilities. A 1985 KHJ-TV trade advertisement made share its central boast, then supplied charts and footnotes defining the comparison. The fine print is the useful part for a modern reader: geography, dates, measurement service, and sign-on-to-sign-off scope. The large headline gets your attention. The small type tells you what the headline is entitled to claim.
A percentage gain was not the same as extra points
A station announcing a ten-percent improvement was not necessarily announcing ten additional rating points. The difference is easy to miss when the advertisement has devoted most of its available space to looking pleased with itself. Percentage change compares a new value with the old value. A point change subtracts one percentage reading from another.
Take another invented example. A household rating moving from 10 to 11 has risen by one rating point. Relative to its starting value of 10, that is a ten-percent increase. It has not risen to a rating of 20. The audience has improved; it has not doubled just because somebody found a larger-looking way to describe the movement.
This is useful when studying the KHJ advertisement’s share-growth pitch. The relevant questions include the starting value, the ending value, and whether the claim describes a relative increase. An arrow pointing upward is good advertising company. It cannot answer those questions by itself. The same scrutiny works when a seller celebrates a competitor’s decline: a dramatic percentage loss can begin from a comparatively small base.
Nobody watching from the couch needed to calculate this before the evening comedy. The distinction becomes valuable later, when the period’s sales language starts circulating as history. You can enjoy a beautifully excessive trade ad and still ask what its percentage actually means. The original buyer was supposed to notice both the artwork and the accounting.
Three people on one couch were still one household
Picture three viewers facing one set. One is following the story. One is waiting for another program. One is eating something noisy from a bowl and asking questions at precisely the wrong moment. For a household audience measure, that home is not three separate homes. The domestic complications have not multiplied its household count.
Individual audience estimates require information about people. How many watched? Which ages? Which other characteristics matter to the audience definition? A household rating by itself cannot answer those questions. There is no universal number of people per occupied couch, and applying an invented multiplier does not make the result more historical.
The distinction also works in the other direction. A teenager watching alone on a bedroom set and a family gathered in the main room can produce different person-level viewing within one home. The measurement system has to distinguish the television’s tuning from the people associated with it. Merely knowing that an appliance was on is not the same as knowing who was present.
This is the quickest repair for many overheated ratings claims. When somebody says a show had a rating of 25 and therefore twenty-five million viewers, stop at the unit. The source may have reported households, a demographic percentage, or something else entirely. Before arguing about which show won the decade, find out what the figure was counting. The couch is not a standardized package of four people.
The audience was estimated from a sample
Being a Nielsen family sounded like getting promoted to the board of television. At last, somebody would ask whether the show you liked should stay on. The actual assignment was more practical: a selected household helped represent a much larger population. Nielsen wasn’t wiring every television in America, and being the loudest fan on the block didn’t give your couch an extra vote.

A sample’s usefulness depends on how it represents the population, how its information is collected, and how the resulting estimates are produced. The household down the street with seven enthusiastic television fans does not automatically improve the picture merely by volunteering. Enthusiasm is not a substitute for representation. A roomful of dedicated viewers can tell you a great deal about that room and very little about everyone outside it.
Representing different kinds of homes mattered. Age patterns, location, household composition, and access to television services could affect what people watched. A sample that leaned toward one sort of home could lean toward its viewing habits too. Contemporary arguments about measurement were often arguments about precisely those differences, not simply complaints from executives whose shows had lost.
John Dimling, explaining Nielsen’s move toward people meters in a later research discussion, described the older sample’s tendency toward older and more rural households. That is a specific methodological issue, rather than proof that every old rating was worthless. A useful estimate can still have weaknesses. The honest response is to examine them, especially when the business consequences of a small change are very large.
The set meter knew where the dial had landed
An electronic set meter could record television use and tuning. That was a substantial advantage over expecting someone to reconstruct every channel change from memory. A restless viewer could visit several programs without ever thinking of the excursion as an event worth writing down. The equipment had a more literal interest in the route.

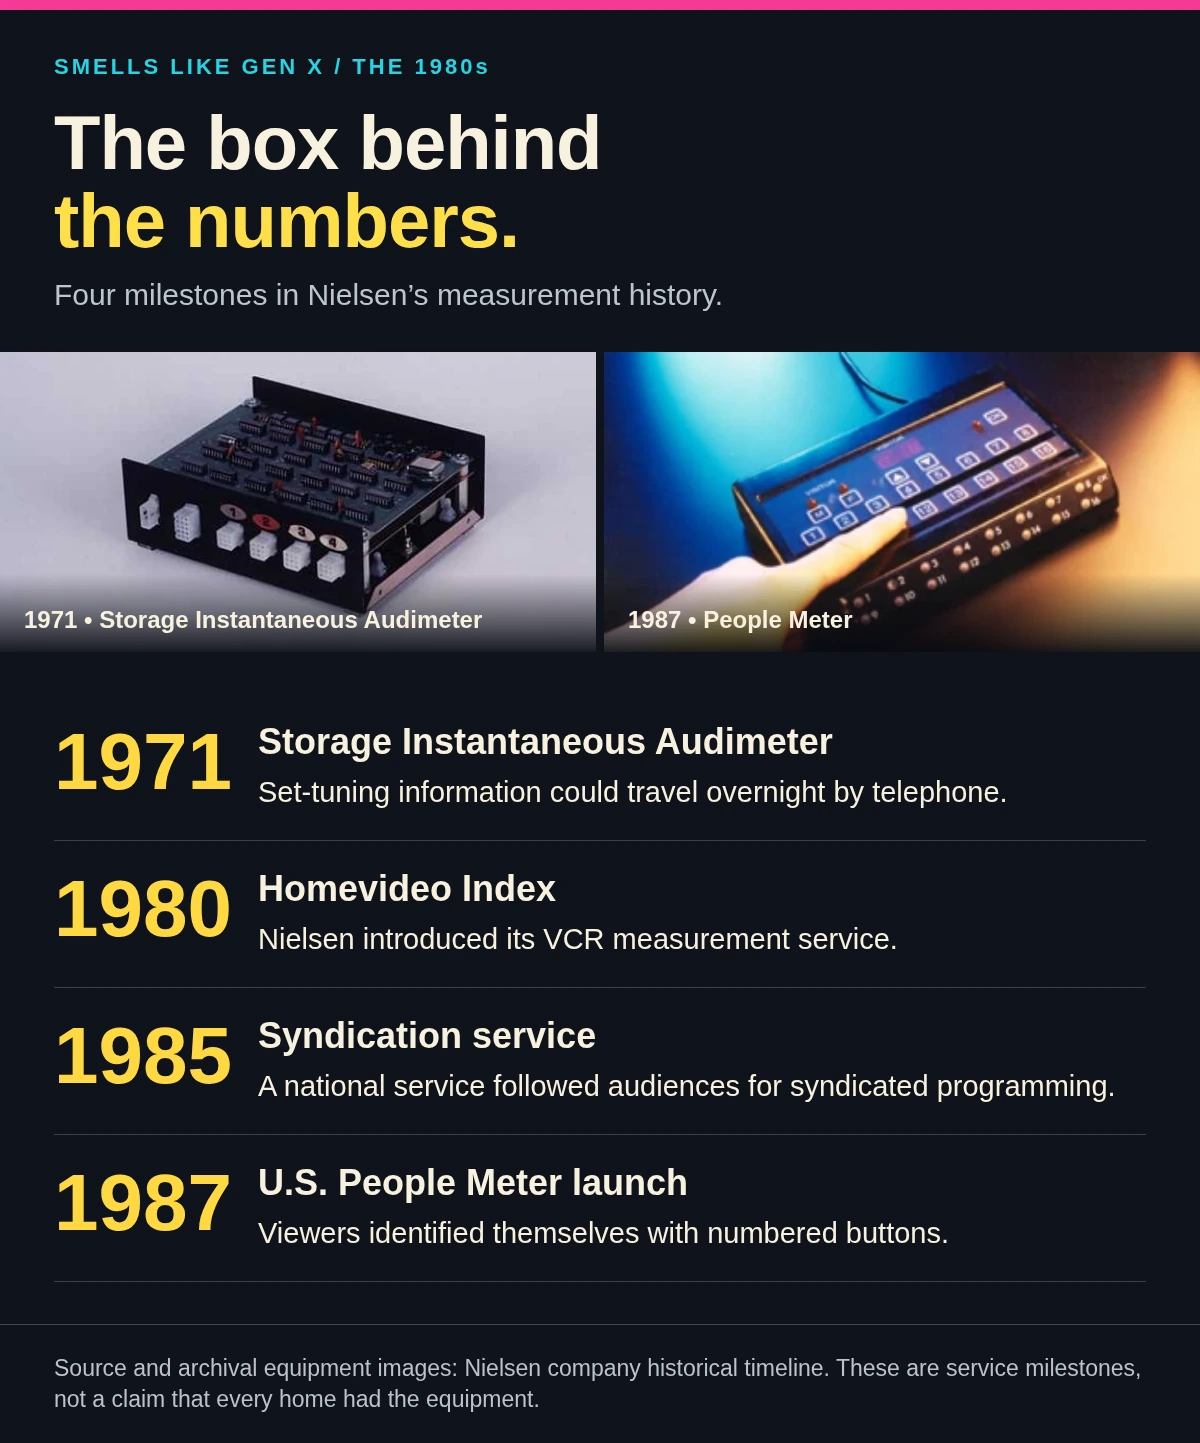
Nielsen’s history places the Storage Instantaneous Audimeter in 1971, before the decade we’re visiting. It could store set-use information and send data overnight through a telephone line. Electronic measurement did not suddenly begin when the late-eighties people meter arrived. The earlier equipment had already addressed the problem of following the set.
Following the people was another job. A set left on while everyone went to the kitchen was still tuned somewhere. A parent entering halfway through an episode changed the room’s audience without changing the channel. Those are ordinary household events, and they expose the limitation of treating a tuning record as a complete account of human viewing.
Think of the difference as two questions asked from opposite sides of the room. What was the television doing? Who was watching it? The first could be recorded electronically without resolving the second. The development of audience measurement involved finding ways to bring those answers together, preferably without requiring the household to turn its leisure time into a second clerical occupation.
The diary asked people to remember the evening
A paper viewing diary gave research an account that a tuning meter alone could not provide. People recorded viewing information, including who had watched. The task sounds simple until you reconstruct an actual evening: the program starts, someone leaves, somebody changes channels during a commercial, and half the room later disagrees about what was on.
A diary relies on cooperation and accurate reporting. Write things down promptly and the job is easier. Put it off and routine can start impersonating memory. You know what you usually watch on a particular night. That is not necessarily what you watched this time. A familiar title is especially convenient when the real answer requires remembering an unfamiliar station or a short visit to another program.
That does not make every diarist dishonest. Most household mistakes are perfectly capable of occurring without a conspiracy. People forget. They round an experience into a simpler story. They confuse a planned viewing with the one that actually happened. The same family that cannot agree who finished the milk has been handed a record-keeping assignment involving several people and a television.
The important historical distinction is that diaries and meters served different measurement functions. Saying eighties ratings were all written down ignores electronic tuning measurement. Saying everything was automatically known ignores the work people supplied. The period’s research system combined machinery with human reports, and both parts needed scrutiny. Neither a pencil nor a wire removed the household from the process.
Your station’s audience was not the whole country
The station identification during a break told you where the national program had arrived. It also marked a business with a local audience to sell. A station wanted people watching its news, its syndicated shows, and the rest of its schedule. National network averages could not describe every part of that job.

A local audience estimate concerns a defined market. A national estimate concerns its own larger universe. The same word, rating, does not make the two denominators identical. A local station’s strong showing at eleven o’clock cannot be laid beside a national prime-time percentage as though they were competing in one league table.
The KPTM advertisement shown here makes that distinction tangible. It sells an Omaha–Lincoln station’s progress using its local setting and audience story. Those details are part of the claim, not inconvenient footnotes to be removed when telling a better story. A station can celebrate a real achievement without becoming the most-watched network in America.
This also explains why childhood recollections differ so much by city. A syndicated favorite might belong to an independent station in one market and a different station or hour somewhere else. The national network chart did not contain the whole local television experience. To reconstruct that experience, you need the station, the market, and the date, along with the program somebody remembers watching.
Sweeps gave the calendar a sales department
February, May, July, and November became familiar sweeps months in television’s audience-research calendar. Local audience information gathered during these periods helped stations and advertisers assess audiences. That practical commercial role is why sweeps acquired a reputation much larger than the modest business of filling in a diary.
For a viewer, the term could arrive attached to an especially emphatic promotion. Something important was happening. A story had been prepared, an attraction announced, or a reason supplied to stay with the station. The excitement on the screen and the business of demonstrating an audience were operating in the same neighborhood.
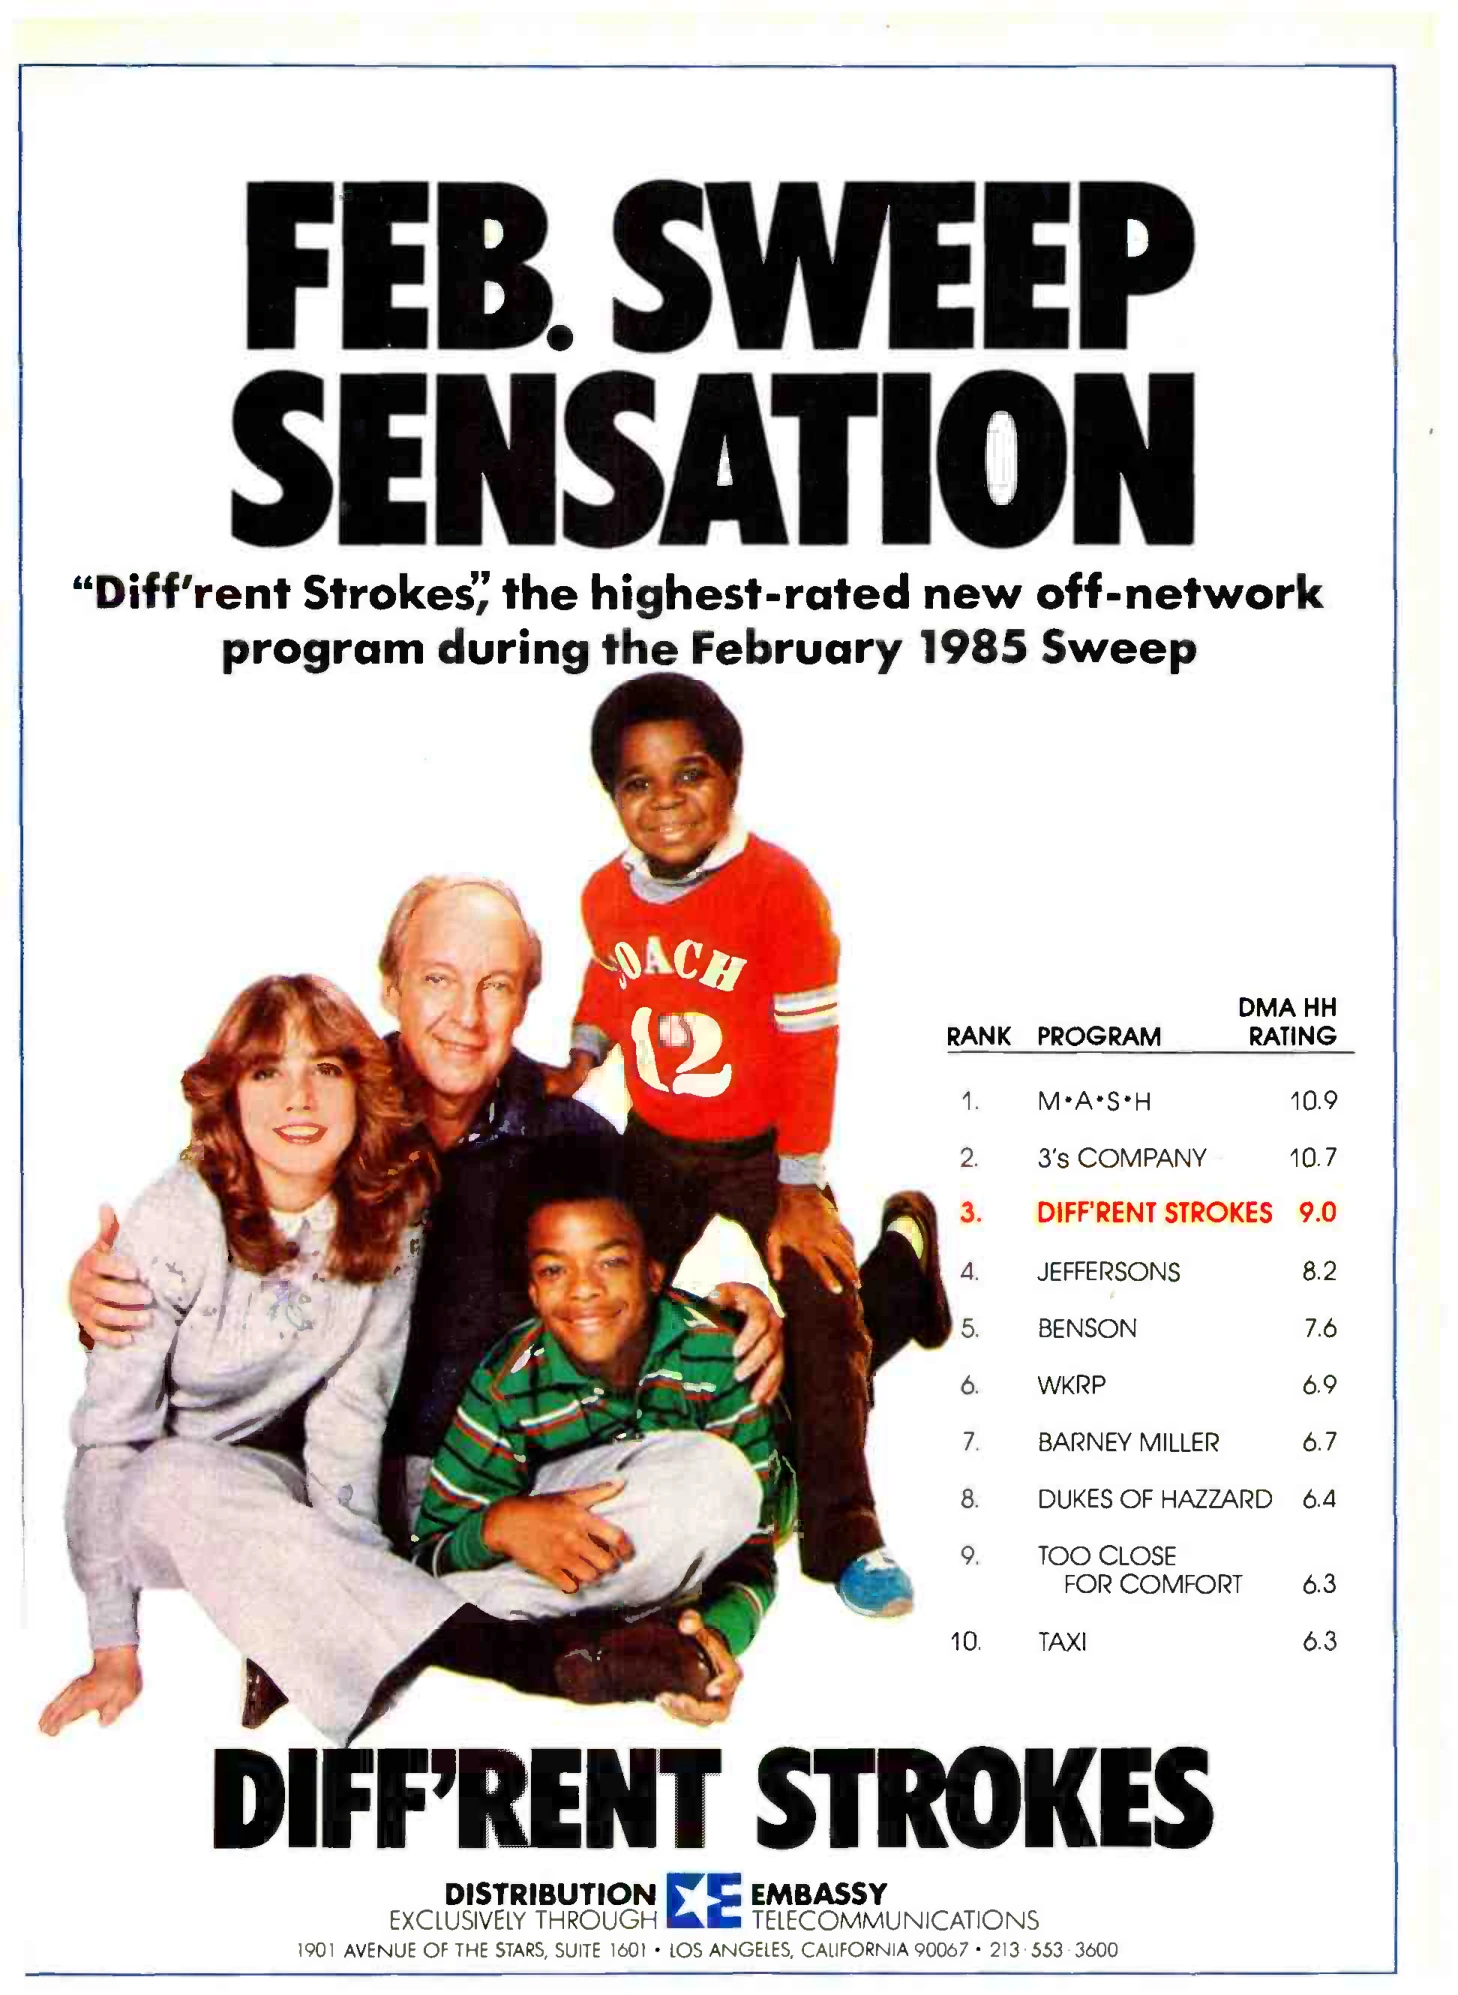
The 1985 Diff’rent Strokes advertisement is a useful little time capsule. Its February-sweeps boast concerns a defined off-network syndication comparison. It is not a claim that those reruns outranked every original network series in prime time. The cast photograph makes the page inviting; the comparison category makes the number intelligible.
Sweeps should not be mistaken for the only times anyone measured television. National measurement had its own continuing systems, and metered local services also complicate the picture. The tidy childhood version, in which four special months determined everything and all other viewing disappeared into a hole, leaves out too much. Sweeps mattered because particular audience information mattered to particular transactions. Television’s accounting calendar was more elaborate than the promotional nickname suggested.
Advertisers wanted to know who had stayed
A crowd is useful. The right crowd can be more useful to a particular advertiser. Someone buying time to sell a product wanted an audience likely to matter for that product, within the categories used to plan the purchase. Total household popularity was therefore only one part of the conversation.

Demographic audience measures address defined groups. The denominator for an adult age-group rating is that group within the specified universe, rather than all television households. A percentage can look familiar on the page while describing an entirely different population. The labels are doing essential work, even when a sales headline would prefer you admired the large number first.
The 1985 TNT variety-show advertisement pictured here is revealing precisely because it stresses ages 18–34 and an audience screening. This is the proposed entertainment attraction in the ad, not the Turner cable channel that arrived later. Its producers are selling a response from a desirable group. They are not presenting a national Nielsen season championship.
For viewers, this business logic could feel rude. A program with a loyal audience might not deliver the audience an advertiser or network particularly wanted. The people watching were real; the commercial value assigned to reaching them varied. That tension runs through television history. The industry could talk enthusiastically about serving the public while discussing which portion of the public would be most attractive to sell.
An overnight was an early report, not an eternal verdict
Speed made audience information more useful. A network did not want to wait until everybody had forgotten a premiere before learning how it had performed. Electronic transmission helped put numbers into the next day’s conversation, and the language of overnights made the results sound almost like the morning weather.
An early number still needs a label. Which markets or sample supplied it? Is it a household measure or a person-level demographic report? Does it cover the complete broadcast? Has it been revised? An overnight and a later national result should not be treated as competing memories of the same perfectly fixed statistic.
The people-meter transition made the distinction especially visible. The business wanted demographic information more quickly and continuously, not merely a faster account of whether a set had been tuned to a network. A report arriving sooner could change discussions about advertising and programming sooner too. Speed had a commercial purpose beyond giving newspaper readers something fresh to argue about.
That urgency did not turn every premiere into a complete test of a series’ future. One night can be affected by competition, promotion, availability, and curiosity. An audience may try a new program and not return. Another series may build recognition more slowly. The morning number is evidence about that measured broadcast. It is not a mechanical instruction explaining how all future viewers will behave.
The television season did not observe New Year’s Eve
A television season crosses the calendar with very little concern for the way people label a decade. A fall premiere and the following spring’s episodes generally belong to one broadcast season. When an annual list is identified by its ending year, a show launched the previous autumn can quite properly appear there.
That is why the rankings for the season ending in 1980 need their season label kept attached. The page is not necessarily an inventory of everything broadcast between January 1 and December 31. Its title offers a convenient doorway; its underlying period tells you what comparison you have entered.
The same care applies farther into the decade. The 1986–87 season’s prime-time standings describe that season’s competition. They should not be casually presented as a full year of results produced by the new national people-meter service that launched later in 1987. Methodology and calendar need to agree before the history sounds confident.
For a reader, this is a small habit with a large payoff: carry both years when the context needs them. It prevents premieres from migrating backward, finales from being filed under the wrong season, and a familiar annual page from being asked to prove something outside its period. The industry had enough arguments already. There is no need to introduce a fresh one by dropping half the date.
A season rank and a giant farewell told different stories
The last episode of M*A*S*H provided the sort of television occasion people remember as an evening, not a decimal. The farewell became a remarkable audience event in February 1983. A season-long series table answers a different question: how regular programs compared across the defined season and its averaging rules.
The 1982–83 prime-time season page is therefore useful beside the farewell, provided the two are not collapsed together. An extraordinary single broadcast does not automatically give the series an identical season-average audience. The farewell’s size and the season’s standings can both be true without matching.
Nielsen’s historical timeline records a 60.2 household rating for the finale. That is a household percentage, not a claim that only 60.2 million individual viewers watched. To discuss people, use a separately established person-audience estimate. To discuss season rank, use the season table. Each number deserves to keep the job it was hired to do.
The distinction matters for reunions, finales, major news coverage, sports, and special events generally. A massive night can become a cultural landmark. A dependable series can accumulate importance through repeated strong seasons. Neither achievement requires pretending the other measurement never existed. You can appreciate the farewell without moving its audience into every ordinary episode that preceded it.
The commercial break was the reason for the spreadsheet
A commercial network offered entertainment to viewers and audience access to advertisers. The break interrupted your evening because someone had paid for an opportunity to reach the people having that evening. Ratings helped buyers and sellers discuss the size and composition of the opportunity.
An estimate does not prove that everyone watched the commercial attentively, remembered the product, or bought it the next day. Those are further questions. A person reaching for the refrigerator during a break is an excellent reminder that being counted within a television audience and absorbing every advertising message are different experiences.
The cost of reaching an audience also depends on how the transaction is defined. A large audience can support a different price from a small one, while the desirability of a particular group and the surrounding program can affect the discussion. There is no one conversion that turns an old household rating into a universally correct commercial price.
For the family, the connection surfaced through consequences rather than rate cards. A show moved. Another received more promotion. A familiar time period was filled by something cheaper or more promising. Research did not write every decision by itself, but it supplied a shared commercial language. The room wanted to know what happened next in the story. The people selling the break wanted to know how many of the right viewers would still be there to see it.
Scheduling tried to keep the room from wandering
A television schedule offered a sequence, and the network hoped the audience would treat it that way. Finish one comedy, stay for another, then settle into the drama. From the couch, changing channels required very little justification. From a scheduling office, every departure was a practical problem worth understanding.
A strong lead-in supplied an opportunity to introduce another program to viewers already present. It did not transfer them by deed of ownership. The next show’s title sequence could be a welcome invitation or a very efficient reminder to inspect another channel. The audience had opinions, even if the equipment recorded them as movements.
That is part of the business story behind NBC’s rise through the eighties. A successful evening was more than a collection of isolated titles. Placement, promotion, and compatible attractions could help programs work together. Explaining the strategy does not require inventing a rule that every show following a hit became one itself.
The measurement questions follow naturally. Did the audience stay? Did a different group arrive? Did people leave television altogether? Did the next program perform strongly on its own terms? Household totals and demographic details could illuminate different parts of that movement. The family just called it seeing what else was on. The network had an expensive reason to call it research.
Cable made the old three-way argument less complete
A family that acquired cable gained more than extra channel numbers. It gained new ways to leave the major networks while still watching television. A movie, a sports channel, a children’s service, or an independent station could take the evening somewhere the familiar network standings did not fully describe.
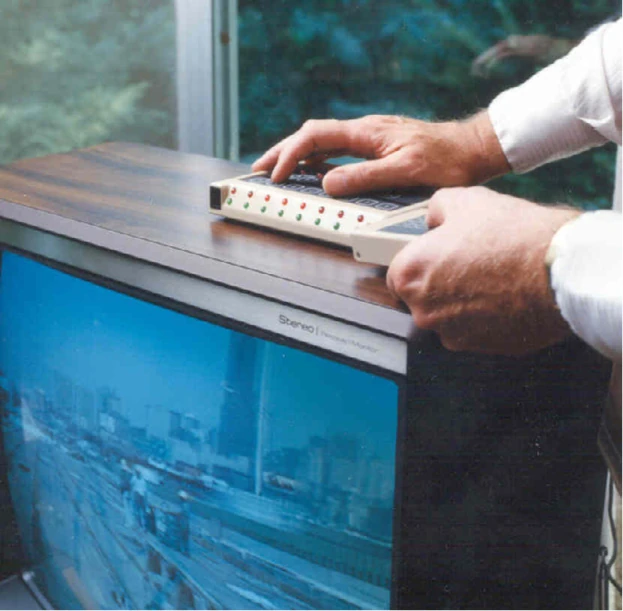
Nielsen’s historical account dates its Homevideo Index to 1980, addressing cable, VCRs, and other technologies. The changing screen was already a measurement problem at the beginning of the decade. The appearance of more choices did not wait for researchers to finish explaining the previous arrangement.
There is a denominator trap here too. A cable service’s performance among homes able to receive it is a different question from its audience among all television homes. Availability has to be defined. A program can be important within a subscription service without producing a national household percentage comparable to a widely distributed broadcast hit.
The household experience of getting cable in the eighties helps explain the pressure. Viewers discovered new choices at different times, on different systems, with different subscriptions. A national story built only from three network averages misses part of that movement. The old scoreboard remained useful, but it no longer described every interesting place the television could go.
A tape could preserve the show and complicate the count
A VCR separated a broadcast’s scheduled time from a viewer’s eventual viewing time. The machine could record while the intended audience was elsewhere. Later, the viewer could sit down with the program after the original advertising transaction and the original evening had already happened.
Recording and playback are distinct events. A timer starting does not establish that a person watched the result. A person finally watching the tape is not necessarily part of the audience reported for the original broadcast under whatever rules produced that report. Historical figures need their measurement basis kept intact, rather than repaired with assumptions about everybody who probably taped the show.
It is equally misleading to say audience researchers had no interest in VCRs. The technology was part of the changing environment they were studying. The caution is about the particular published number: an old season table should not be silently converted into a modern live-plus-several-days total. Later terminology belongs to later systems and defined viewing windows.
For anyone who wrestled with recording television on VHS, the distinction feels quite practical. A tape might be watched promptly, forgotten, recorded over, or found months later without a useful label. The set’s old appointment had become a household possibility. Possibilities are harder to count than a correctly identified viewing event.
In 1987, the people meter asked who was in the room
The national People Meter launch brought the two sides of the viewing question closer together. Electronic measurement followed tuning, while household members used assigned buttons to identify their presence. The aim was a more continuous account of people watching, with demographic information available much more quickly.

The button is the wonderfully human detail in the machinery. Somebody still had to use it. Enter the room, leave the room, change who is watching: the people record needed to follow those events. A more sophisticated device could improve measurement without becoming a mind reader hidden beside the television.
Nielsen’s own chronology gives the U.S. launch year as 1987. Contemporary Broadcasting coverage dated September 7 describes daily delivery of national household and demographic ratings beginning September 1. That places the operational change within the decade rather than projecting it backward over every early-eighties family evening.
The business consequence was substantial. Buyers and sellers could obtain more timely information about which groups watched, not merely whether a household set was tuned to a channel. For a viewer, the equipment remained largely invisible. For the people deciding what audiences were worth and what programs to schedule, the way a room became a number was changing.
The new machines did not make the arguments disappear
A new method can produce a different estimate without the public suddenly changing its behavior overnight. That is an uncomfortable possibility when the previous estimate has been helping people buy and sell expensive commercial time. Improve the ruler and someone may dislike the new measurement.

Nielsen also faced a people-meter competitor, AGB. The September 1987 trade coverage documents disagreement over the new services, sample problems, and early results. The debate was not a neat contest between people who believed in science and people who refused it. The participants had technical concerns, business interests, and very specific numbers to examine.
That is why the portrait of AGB’s Michael Poehner belongs here. Audience measurement was made and sold by identifiable companies and executives. Their systems had to recruit homes, gather usable information, identify broadcasts, and deliver reports. Announcing an electronic advance did not remove all those operational obligations.
For a modern reader, the useful stance is curiosity with a working pencil. Ask what changed, which samples were compared, and whether a reported difference concerns households or people. Avoid the two easy extremes: the new system proved every old number fraudulent, or every awkward new number must have been wrong. Neither shortcut explains what the contemporary evidence actually shows.
The same broadcasts could produce several columns
The comparison table in Broadcasting is a better teaching object than a hundred triumphant sales headlines. It sets Nielsen’s outgoing audimeter results beside Nielsen people-meter and AGB figures for broadcasts around the launch. The same evenings appear through different measurement arrangements.
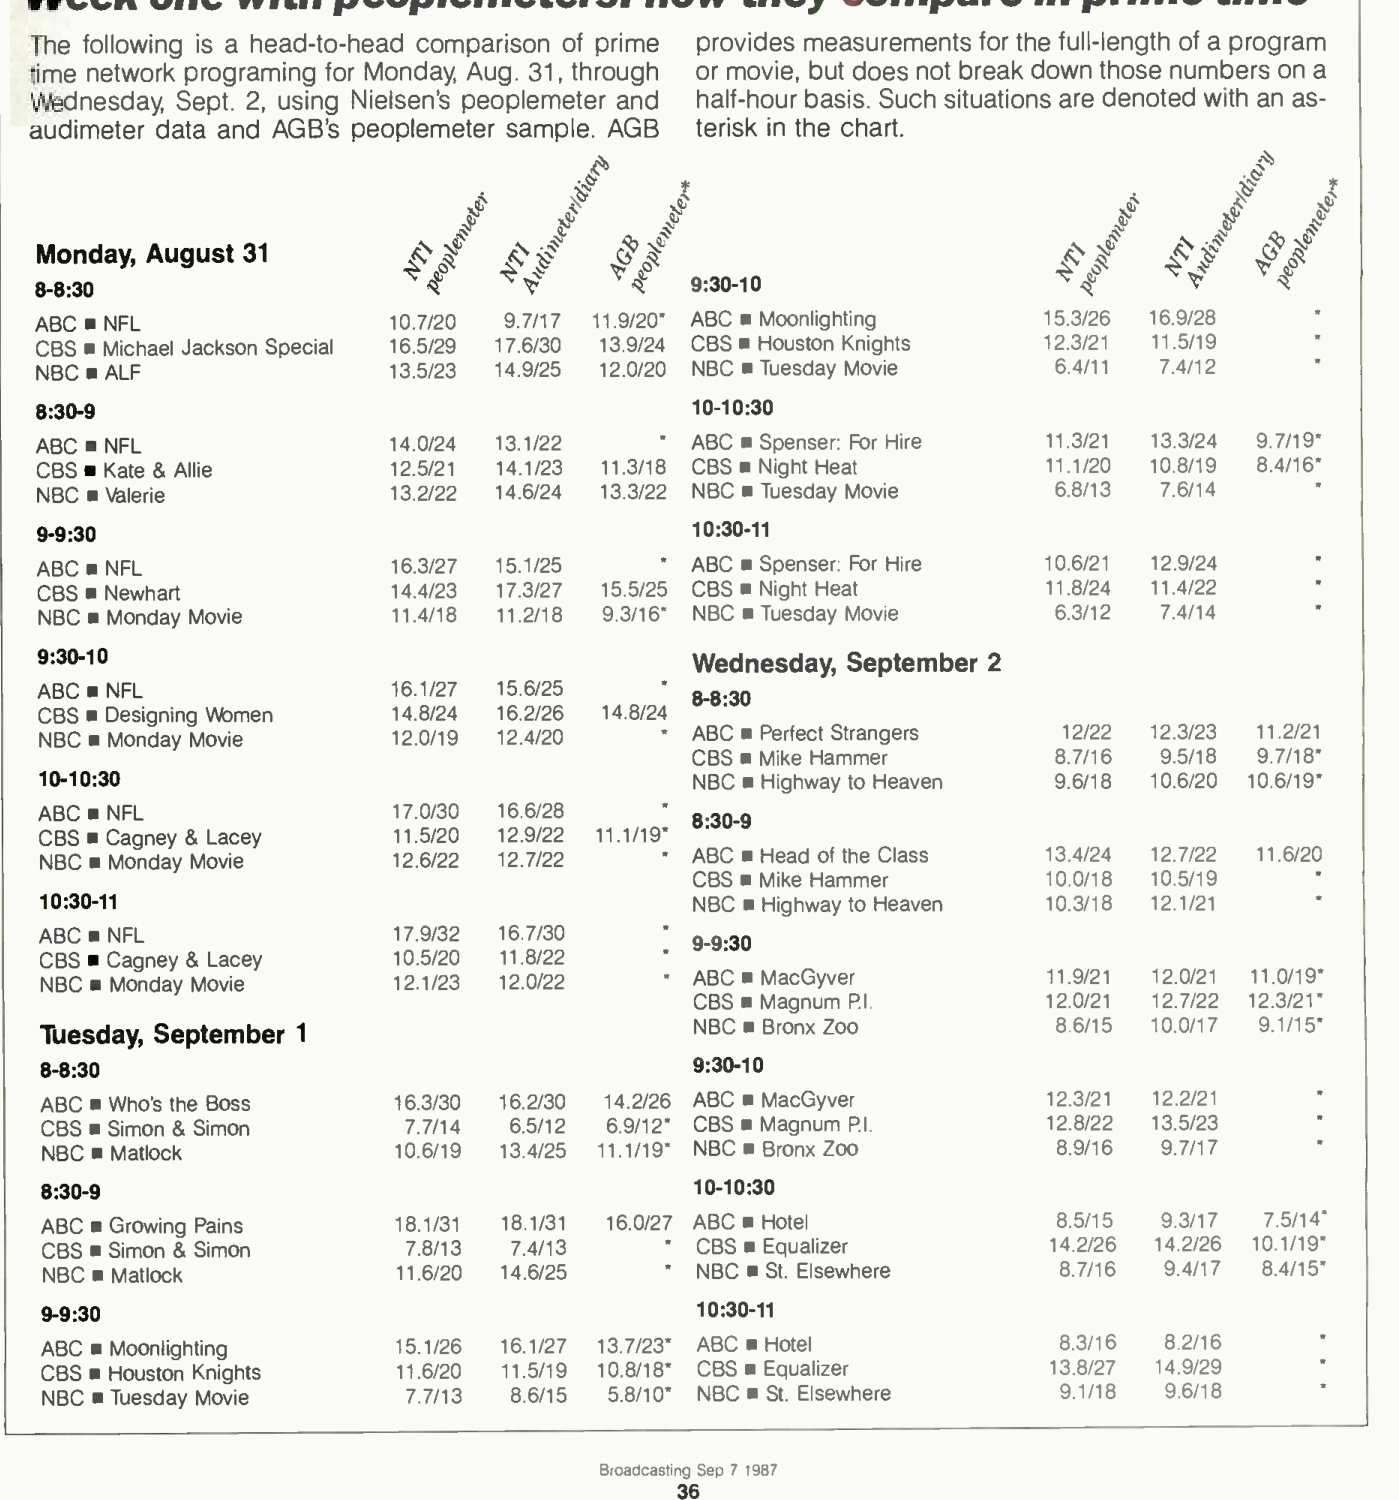
Nobody had broadcast three different versions of the evening. The measuring systems were producing different estimates of the same viewing. That was enough to make executives nervous: advertising money was attached to the answers. From the living-room floor, changing the box beside the television sounded like a technical adjustment. From the sales department, it could sound like someone moving the goalposts while the game was still on.
It also shows why mixing historical figures casually is dangerous. Lift an attractive result from one column, compare it with a rival’s result from another, and the arithmetic can be perfectly executed while the comparison is badly designed. The trouble is not subtraction. It is deciding that two unlike observations belong in the same subtraction.
This lesson extends beyond a disputed launch week. Before comparing a show’s audience across time, establish what each source measured and how. Some comparisons remain useful with a clear note; others need a different basis. A magazine feature can explain that plainly without making the reader attend a statistics course. Keep the labels. They prevent a surprisingly large amount of nonsense.
Children could watch without helping the new button
A child absorbed in a cartoon has many priorities. Correctly maintaining an audience-research record is unlikely to outrank the cartoon. People-meter research therefore had a practical problem: the system needed participation from viewers who might forget, misunderstand, or simply fail to operate their assigned control consistently.
The contemporary launch discussion identified children as an area of concern. Diary reports and people-meter observations could differ, and deciding which better described actual viewing required investigation. It is enough to explain the issue without inventing one tidy percentage that supposedly resolves every network’s children’s audience.
This is also where the familiar annual prime-time lists need a firm boundary. Saturday morning and syndicated after-school cartoons belonged to different dayparts and distribution arrangements. Their importance to children cannot be proved or disproved by whether they appear in a national prime-time season top ten.
You could know exactly when a cartoon started, recognize its theme through a closed door, and have absolutely no idea how many households watched it. Most of us were busy being the audience. Saturday animation and weekday syndication needed audience reports covering those settings; a prime-time chart couldn’t settle the argument. Loving the show was easy. Finding the right scoreboard took a little more effort.
A trade advertisement wanted you to admire its category
The A-Team advertisement pictured here dispenses with subtlety and supplies tombstones for unsuccessful sitcoms. It is an energetic way to sell a program. It is also a reminder that an advertisement chooses the story and the comparison most likely to help its seller.

That does not make trade advertising useless evidence. Quite the opposite: it tells us how sellers wanted buyers to think about programs, audiences, distribution, and competitive strength. The trick is to identify the claim instead of letting the artwork make it larger. A syndication pitch has a different purpose from an independent national season table.
The same scrutiny applies to a phrase such as number one. Number one where? At which hour? Among which audience? During which dates? Against which competitors? A perfectly legitimate local or demographic distinction can sound like a universal championship when all the qualifiers fall off on the way into a retrospective.
Old ads are particularly enjoyable when their confidence remains attached to their context. The A-Team can keep its graveyard joke. KHJ can sell its share improvement. Diff’rent Strokes can celebrate its specified sweep comparison. None needs to be promoted into proof that one program controlled every screen in the country. The original salespeople were already quite capable of sounding impressive without our assistance.
A rank put the audience in order, not into your head
A season rank is an ordering within a defined list. First, tenth, and twenty-third tell you position. They do not tell you the distance between audiences, the program’s cost, its appeal to a particular advertiser, or how warmly a family welcomed it each week.
Two neighboring ranks can conceal a small difference. A larger gap in rank does not translate into a fixed number of missing viewers. Add several ordinal positions and you have performed arithmetic on positions, not discovered an audience total. The calculator can do the work without making the result meaningful.
This matters when looking across the decade. Sustained high placement, a striking single-season peak, and an enormous individual broadcast are different achievements. A defensible comparison must say which it is using. The separate feature on the decade’s most-watched shows takes up that comparison; this article supplies the labels needed to read it.
For a family, none of this dictates affection. A tenth-place program can matter more to your memory than the winner. An early cancellation can become a personal landmark. Nielsen estimated audiences for a business purpose. It was never an instrument for measuring which character you needed company from on a difficult Wednesday.
Read the label before arguing with the number
An old ratings item becomes much easier to use once you ask a few ordinary questions. What period does it cover? What population is measured? Are the units households, people, or a demographic percentage? Is this a national series table, a local station comparison, or one exceptional broadcast?
Then look at the source’s purpose. A newspaper summary may compress a longer report. A trade advertisement may emphasize a carefully chosen victory. A research discussion may explain why two methods disagree. Each can contain useful information, but they are not interchangeable objects simply because all of them contain Nielsen’s name.
The 1988–89 prime-time standings offer another place to practice. Read them as that season’s comparison, with its specific unit and scope. Do not turn the page into a calendar-year total, a cartoon ranking, or a count of every individual who encountered a rerun anywhere.
The useful reward is confidence without bluster. You can explain why a rating and share differ, why a household total is not a viewer total, and why a giant finale need not win a whole season. You can also recognize when the surviving evidence does not support a larger claim. A television argument improves considerably when at least one person has checked the heading above the table.
The room was always more complicated than the report
The living room never experienced itself as a sample, a demographic, or a denominator. It experienced an evening. Someone wanted the sitcom. Someone had already seen that episode. Someone missed the opening because dinner ran late, then asked everybody to explain what had happened while the next scene was happening.
Ratings translated parts of that untidy experience into information the television business could use. Machines recorded tuning. People supplied records and pressed buttons. Researchers produced estimates. Networks, stations, and advertisers argued over what those estimates meant for the next set of decisions. The familiar schedule was connected to an enormous apparatus most viewers never saw.
The ratings weren’t magic, and they weren’t just somebody guessing because the network liked a show. People recruited homes, maintained equipment, filled in records, checked results and argued about the method. The machinery could improve while the arguments continued. That is a fairly human ending for a story that began with a mysterious box telling the rest of us our favorite program wasn’t popular enough.
Return to the wider world of eighties television with those distinctions in mind and the old scoreboard becomes more interesting. The numbers stop pretending to be a verdict on your childhood. They become evidence about how a business tried to count a country full of rooms, each certain that the important show was the one somebody else wanted to switch off.
A few ratings questions before the next commercial
Could Nielsen tell what every American television was showing?
No. Ratings were estimates produced through defined samples and measurement systems. A national audience report was not a census taken from every television. Representativeness, recruitment, equipment, and participant behavior all mattered to the estimate.
What does an 18 rating and 30 share mean?
In our illustrative 100-home universe, 18 homes watch the program and 60 homes use television. Eighteen divided by 100 gives an 18 household rating; 18 divided by 60 gives a 30 household share. These are invented teaching numbers, not historical program results.
Were people meters used throughout the whole decade?
No. Nielsen’s U.S. national People Meter launch was in 1987. Earlier eighties measurement included electronic set-tuning records and diaries serving different functions. Do not confuse the later national change with a simultaneous replacement of every local method.
Does a low ranking mean nobody liked a program?
No. A rank concerns measured audience position within its defined comparison. Affection, critical reputation, production cost, advertiser interest, and later cultural influence are different questions. Viewers can care deeply about a program that attracts a relatively small measured audience.
Sources & Further Reading
- Nielsen’s historical timeline and original measurement-equipment images
- Nielsen audience-measurement glossary: rating, share and audience units
- Broadcasting, September 7, 1987, pp. 35–39: the people-meter launch and parallel estimates
- Broadcasting, May 20, 1985: period station, syndication and audience-sales advertisements
- The Evolution of Audience Measurement: industry discussion including John Dimling
- Annenberg methodological notes on historical Nielsen household and person data
- Nielsen’s explanation of person-level measurement; modern systems are distinguished from eighties practice