Why 90s TV Ratings Were So Much Bigger Than TV Ratings Today
Why 90s TV Ratings Were So Much Bigger Than TV Ratings Today
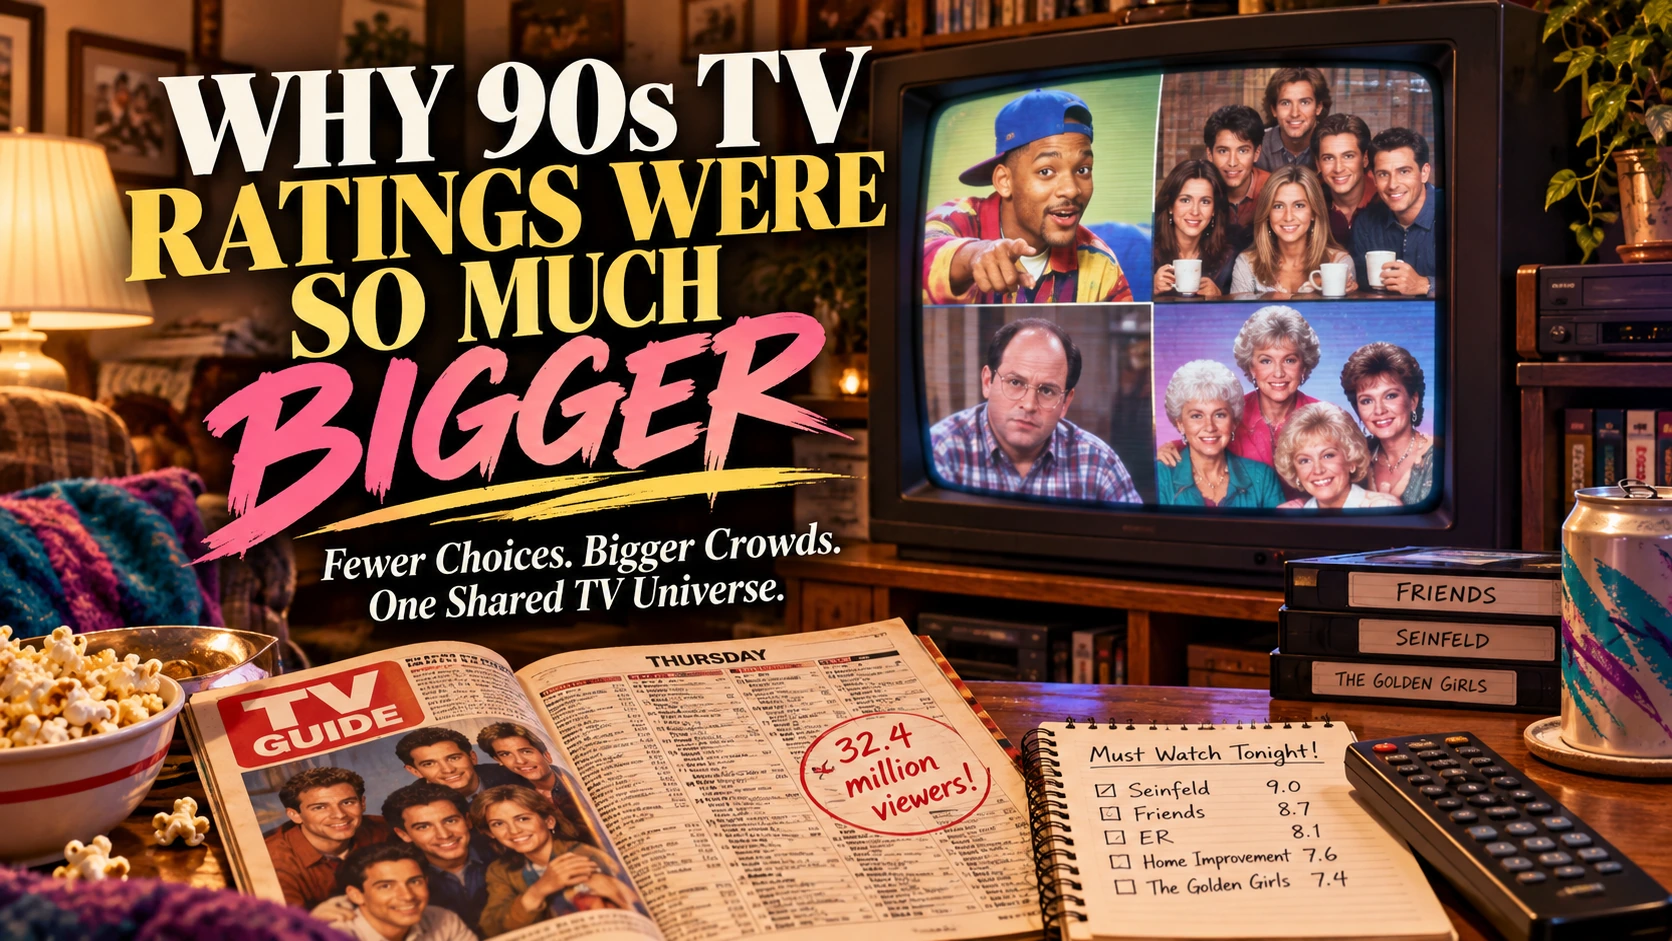
Those giant 90s Nielsen numbers were real, but the television universe was built differently. Here’s how ratings, share, live viewing and fewer choices changed the scale.
Why were TV ratings so much higher in the 1990s?
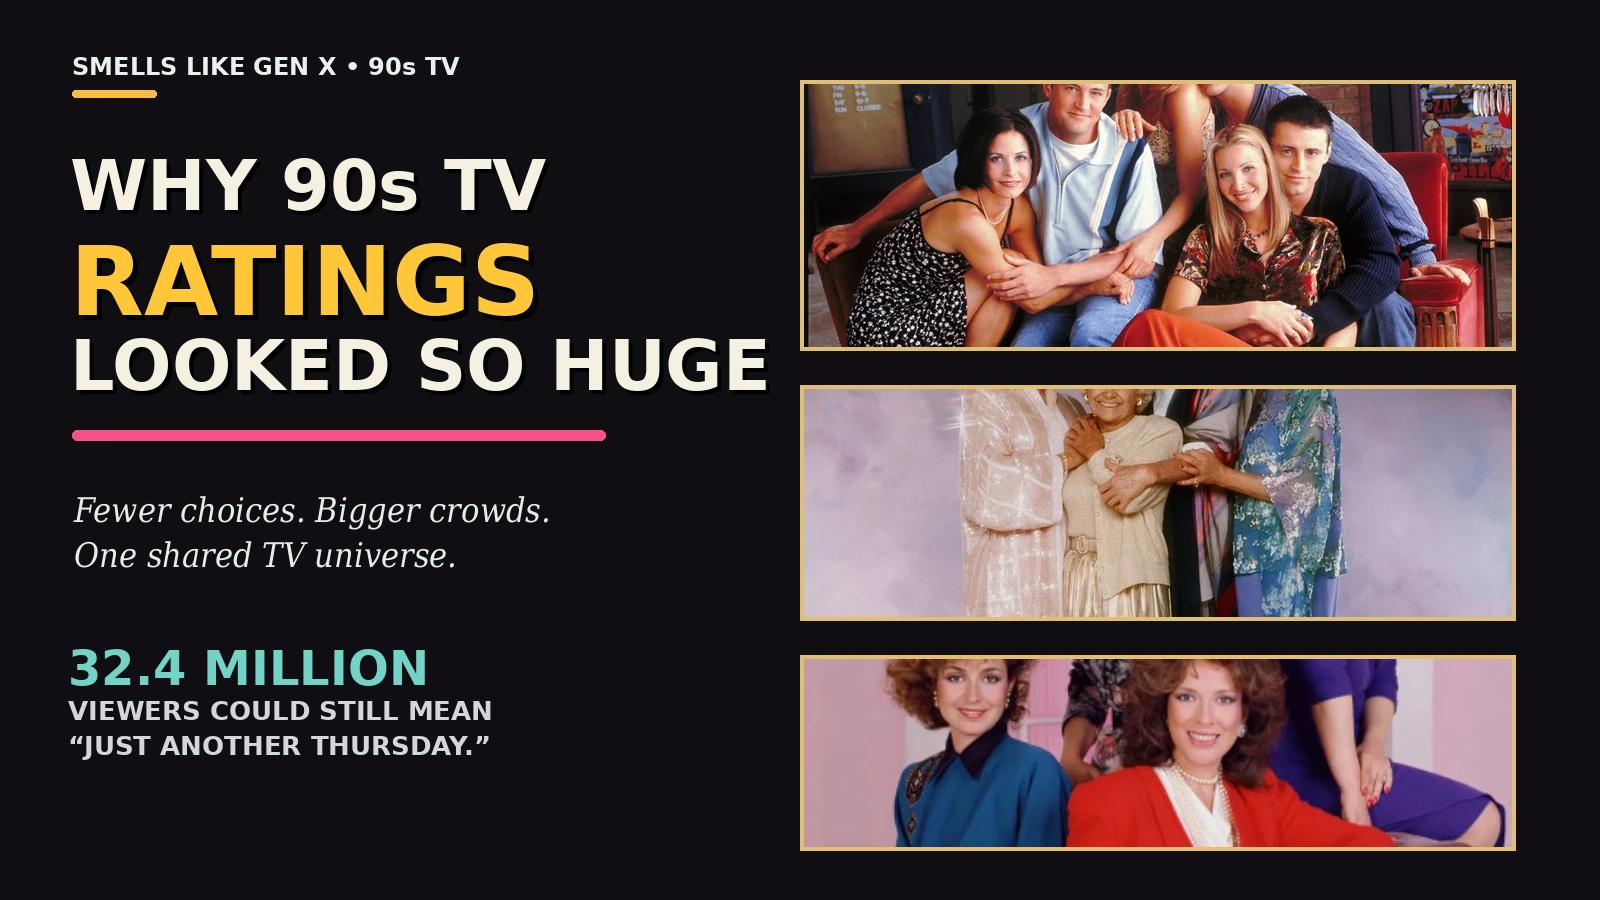
Because television audiences were concentrated into far fewer places at the same time. The big broadcast networks controlled most prime-time attention, DVRs and streaming did not exist, and popular programs were usually watched live. A 20 rating in the 90s meant a huge percentage of TV households were tuned to one program at once; today that attention is scattered across broadcast, cable, streaming, time-shifted viewing, clips and other screens.
A 20 Rating Did Not Mean Twenty Million Viewers
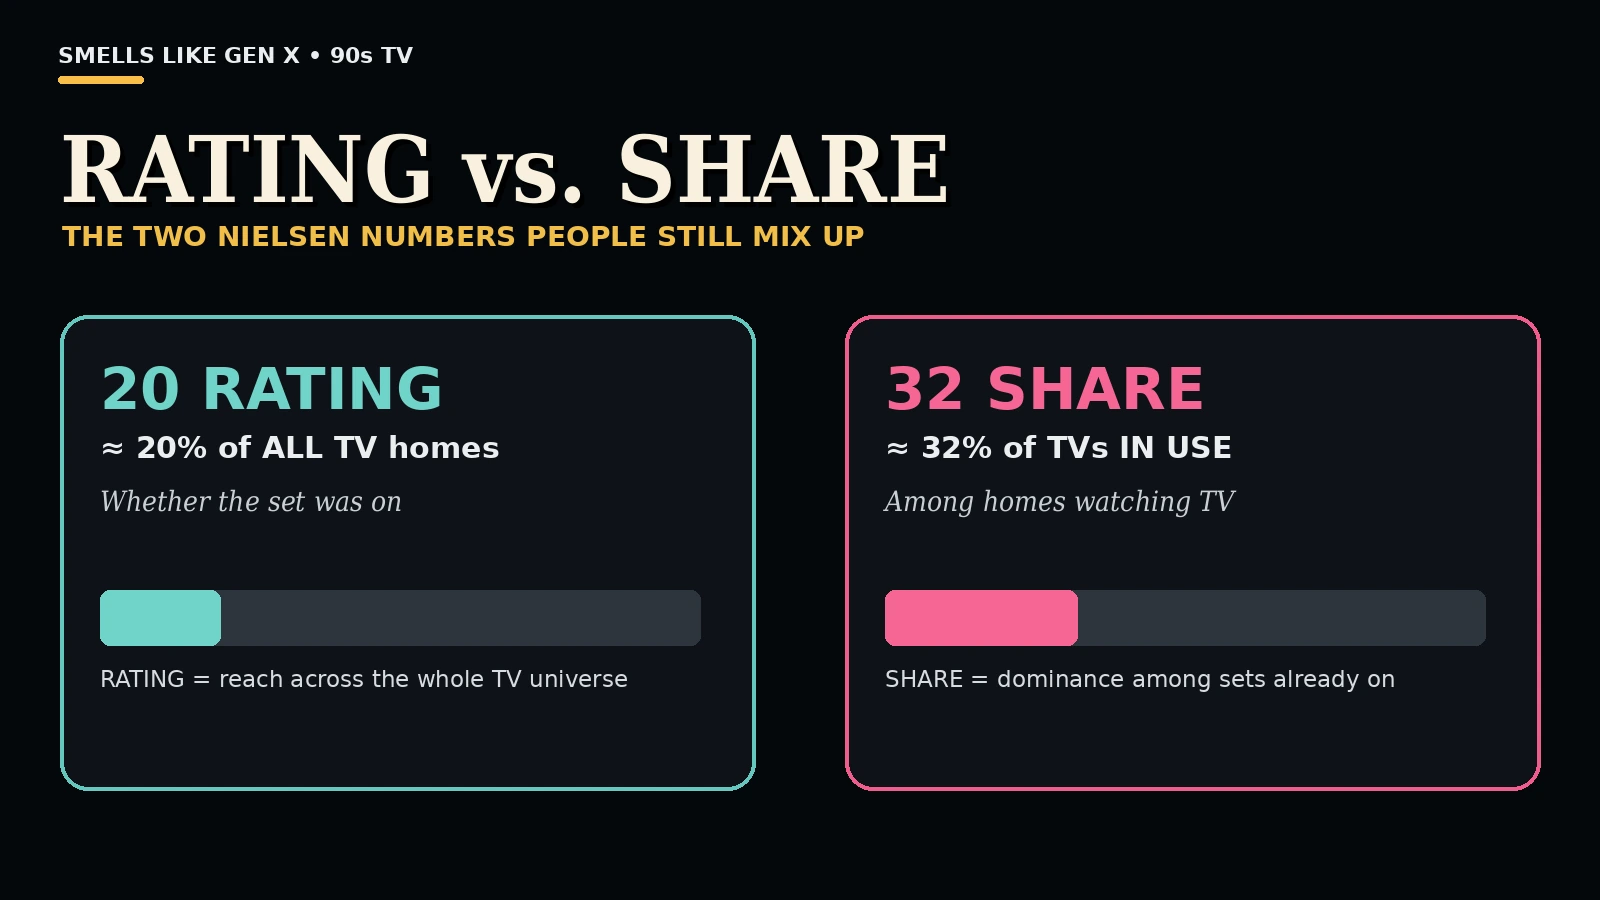
One of the easiest mistakes when looking at old Nielsen charts is reading a rating like a head count. It was not. Nielsen defines a television rating as the percentage of the relevant television population that watched a program. In the household era that usually meant the percentage of television households. So when a 1990s show posted a 20 household rating, roughly one-fifth of the country’s TV homes were tuned to it. That is why the number can look abstract while the actual audience behind it was enormous.
The companion number was share. Share measured the percentage of households using television at that moment that were tuned to the program. If a show had a 20 rating and a 32 share, the first number described its reach across all TV households; the second described how dominant it was among the households that actually had the set on. Those two figures tell different stories, and the distinction matters whenever we compare old charts with modern viewer totals.
Old newspaper tables assumed readers already understood those conventions, which is why they can feel cryptic now. Thirty-five years later, the safe approach is to keep like with like: rating against rating, share against share, total viewers against total viewers, and always with the season and measurement method attached.
Fewer Choices Concentrated Millions of People
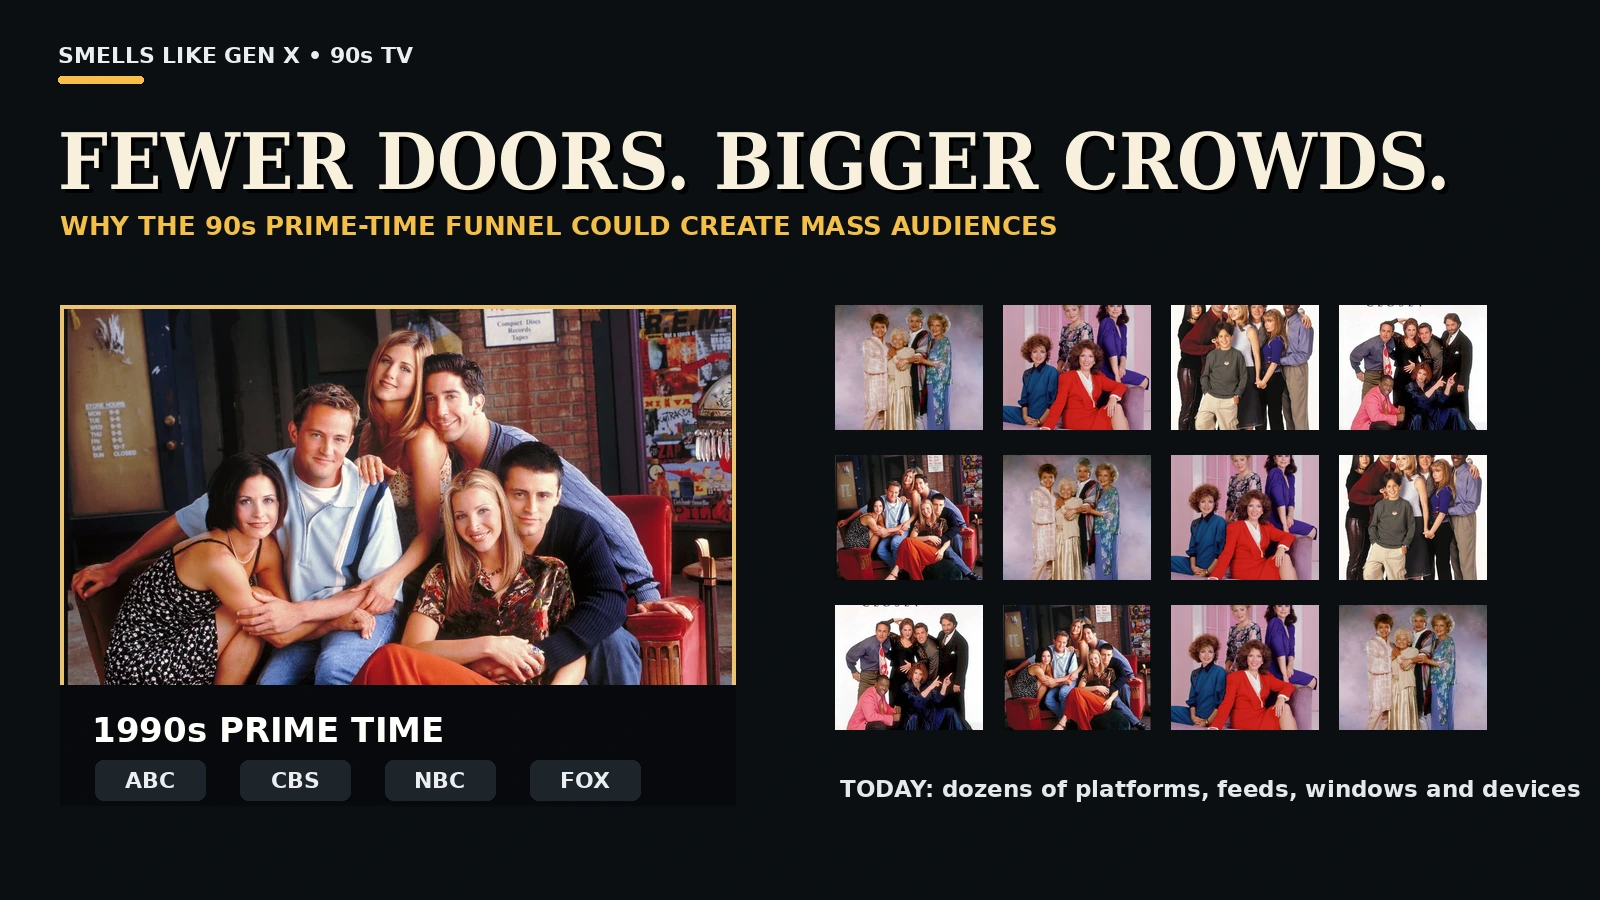
The biggest structural difference was brutally simple: there were fewer places for a mass audience to go. By the 1990s cable was already a major force and Fox had broken the old three-network order, but prime time was still dominated by a relatively small set of broadcast networks. A hit on NBC, ABC or CBS could pull from an audience that had not yet been split among hundreds of streaming originals, personalized feeds, video platforms and on-demand libraries.
That concentration is why the numbers on our 1990s TV hub feel almost alien now. The television universe had more channels than Gen X grew up with in the 70s, but the evening routine was still organized around a handful of mass-market schedules. A great show mattered, but distribution mattered too. The networks were not merely offering content; they were controlling the biggest doors into the living room.
You can see the difference in ordinary behavior. If you did not like what was on the four or five big channels, your alternatives were cable, a rental, a tape, radio, or doing something else. Today the entertainment menu is effectively bottomless. The audience did not lose interest in television; it gained exits.
Most Big TV Was Watched When It Aired
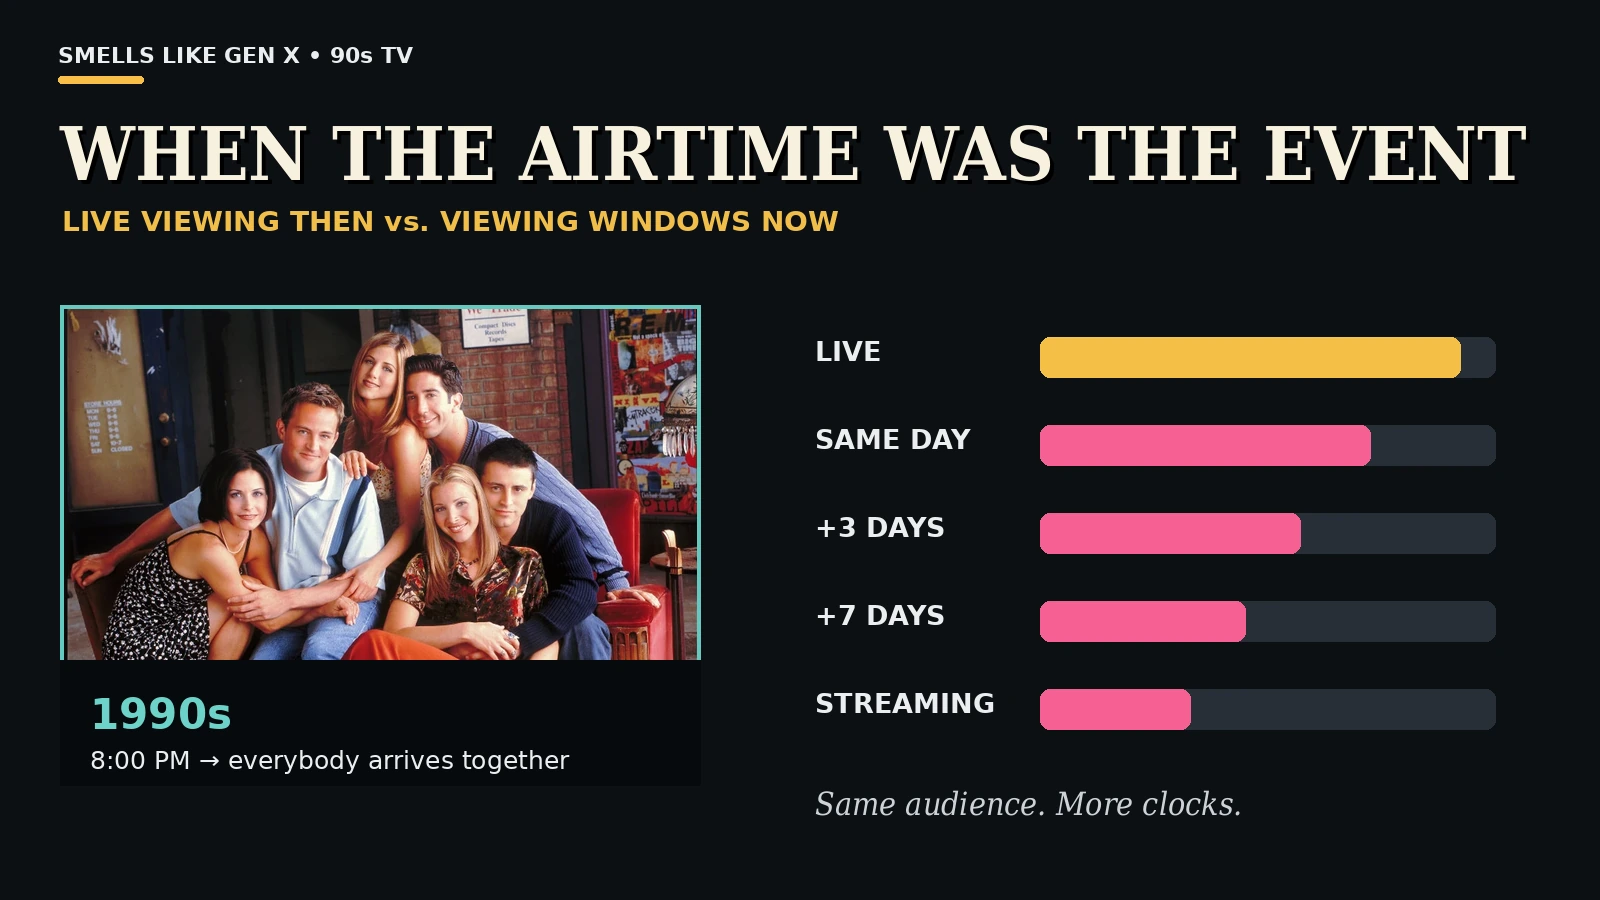
VCRs existed, obviously, and plenty of us had piles of tapes with half the labels crossed out. But time-shifting was friction. You had to program the machine correctly, have a blank tape, hope nobody changed the channel, and remember that the show was there afterward. For the biggest programs, the easiest option was still to be on the couch at the appointed hour.
That behavior made audience concentration even stronger. Modern measurement has to account for same-day playback, three-day viewing, seven-day viewing and streaming windows. Nielsen itself now publishes multiple variants because viewing no longer happens in one neat burst. In the 90s, the live telecast was the event. The audience arrived together, which made the rating bigger and made the next morning’s conversation possible.
The schedule therefore acted like a funnel. Thursday at nine did not merely describe when a program was available; it described when millions of people would encounter it. The technology to escape that schedule existed, but it had enough hassle attached that the appointment remained powerful.
1991, 1996, 1997 and 1999 Tell the Same Story in Different Ways
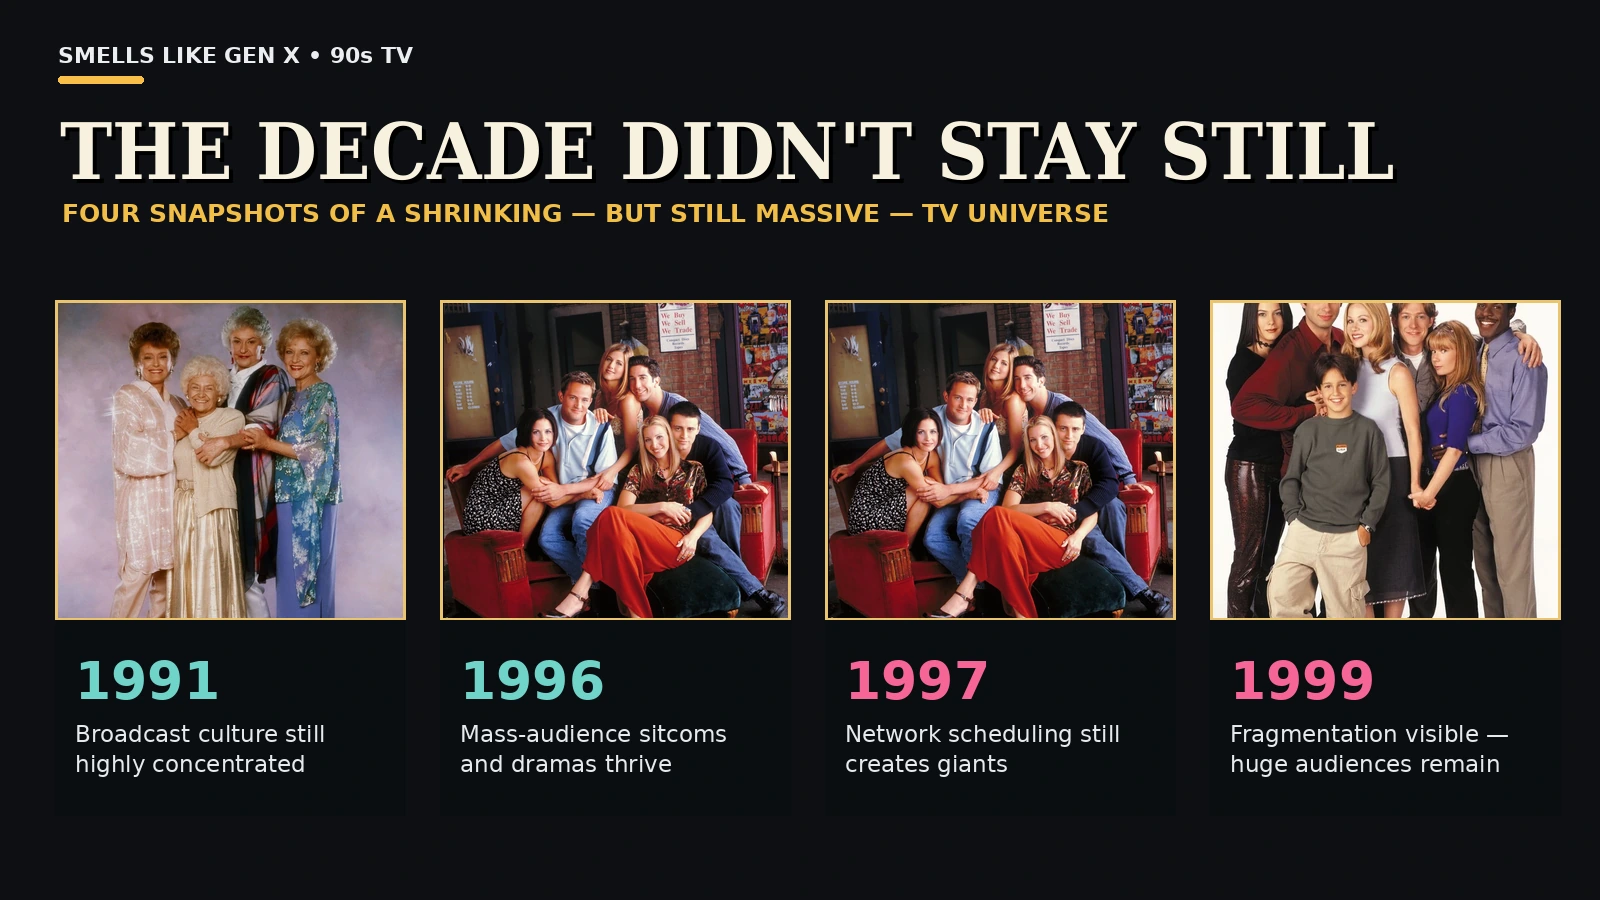
Look at the biggest shows of 1991 and you are looking at the tail end of an older network order: Cheers, 60 Minutes, Roseanne, A Different World and other broad-audience programs could routinely reach a share of the country that would be extraordinary today. The point is not that every household watched the same thing. The point is that the top of the chart was genuinely national.
By 1996 and 1997, cable had expanded and the network business had changed, yet ER, Seinfeld, Friends and the NBC Thursday machine still generated huge mass audiences. Then 1999 showed both realities at once: the big networks could still create national hits, but fragmentation was becoming impossible to ignore.
Those four snapshots are useful because they prevent us from turning the decade into one static picture. The 90s began with a more concentrated broadcast culture than they ended with. The ratings stayed huge by modern standards while the underlying system was already loosening.
One Point Represented More Homes as the TV Universe Grew
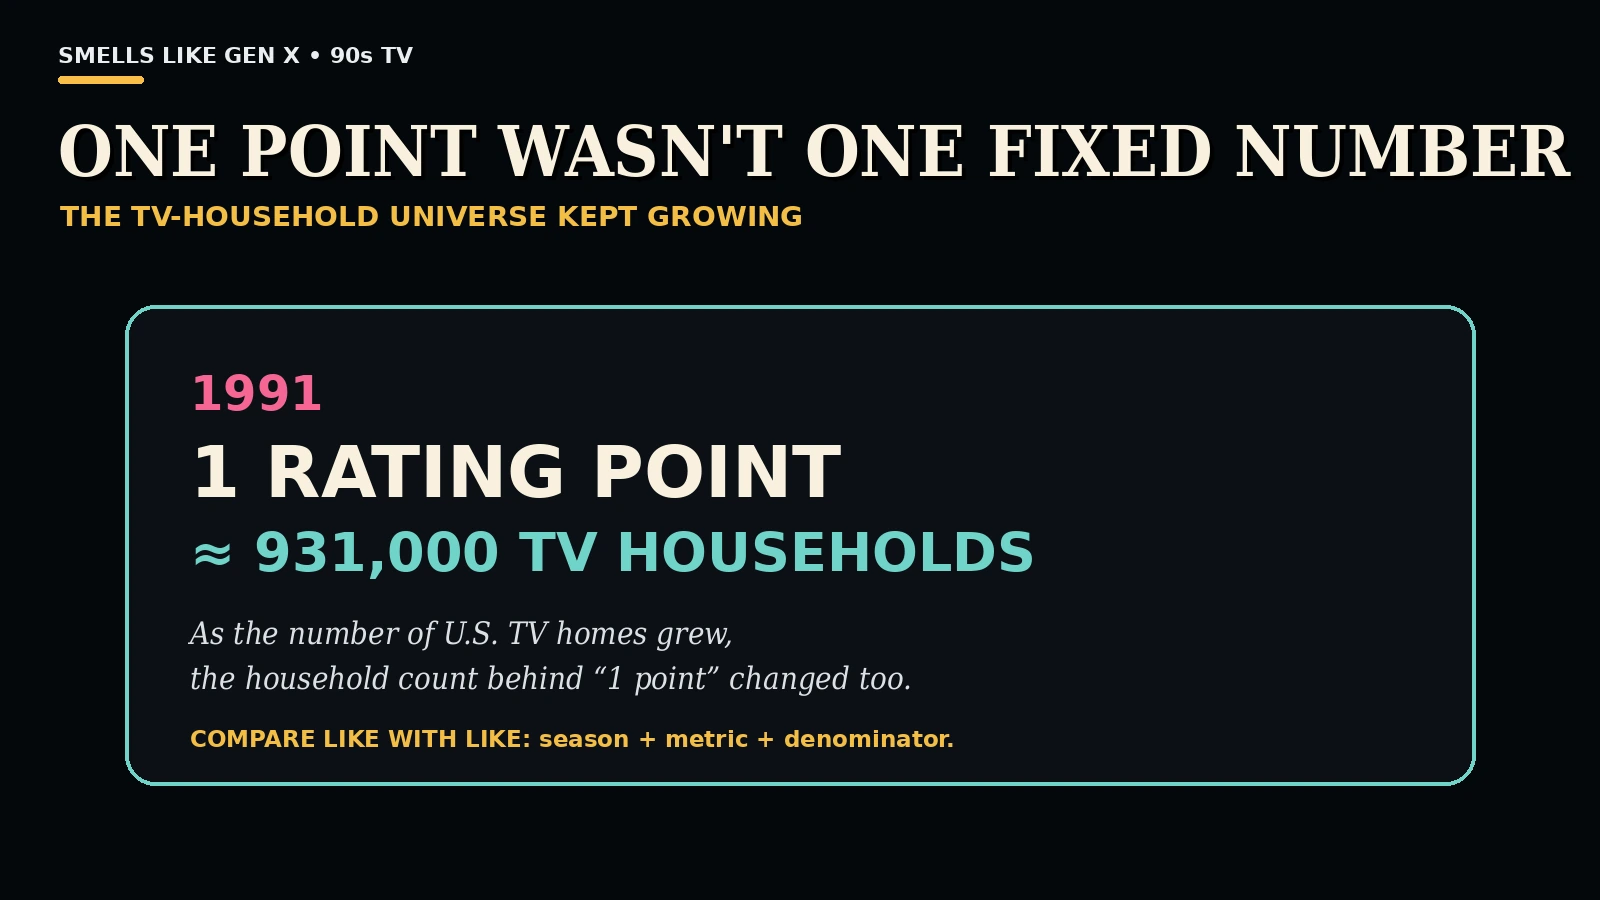
There is another reason old ratings tables can trip people up: a rating point was not a fixed number of households forever. The television universe grew as the number of U.S. TV households grew. Contemporary Los Angeles Times reports routinely explained the current conversion. In early 1991, for example, one rating point represented roughly 931,000 households. A similar numeric rating in another year could therefore represent a different number of homes.
That is why raw household ratings, viewer totals and share should not be mixed casually. A show could have a lower household rating than another program in a different era and still represent a comparable number of viewers because the underlying population changed. Historical television data is simple enough to understand once the denominator is visible; without it, the same figures can be misleading.
The practical rule for Smells Like Gen X is straightforward: when we tell a ratings story, we name the season and the metric. That keeps the nostalgia honest and prevents a dramatic-looking number from doing more work than it can support.
Lead-Ins, Blocks and Habits Kept People From Leaving
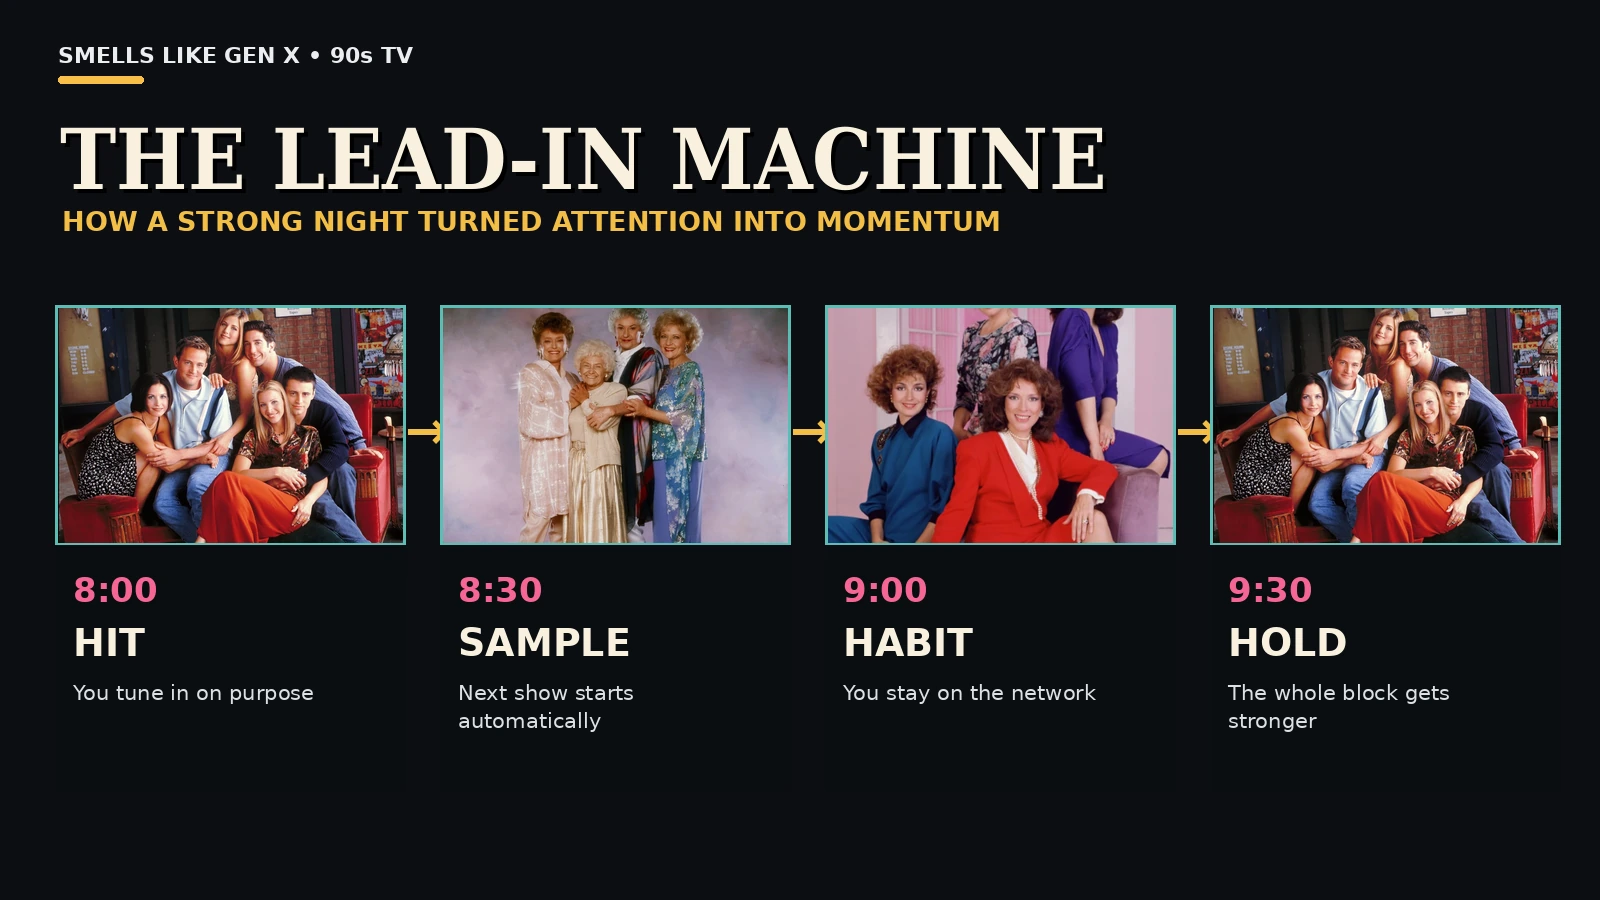
Networks also had an advantage that streaming interfaces only partially recreate: momentum. If you were already watching an 8 p.m. hit, the 8:30 show started without asking you to make another decision. Strong lead-ins created sampling, and successful blocks trained households to leave the channel alone. NBC Thursday is the obvious example, but CBS Sunday, ABC family comedy blocks and Monday Night Football all used habit as a ratings weapon.
That is also why appointment television matters to the measurement story. A rating was not only a verdict on one program. It reflected the schedule around it, the night of the week, the network’s strength, and whether viewers had learned to treat that time slot as theirs. The remote control existed, but inertia was a business model.
A strong schedule could make a decent show look enormous for a while, and a weak time slot could make a good show hard to find. This is one reason historical ratings should be read as evidence about television systems as much as evidence about individual quality.
Demographics Made a Smaller Audience Valuable Too
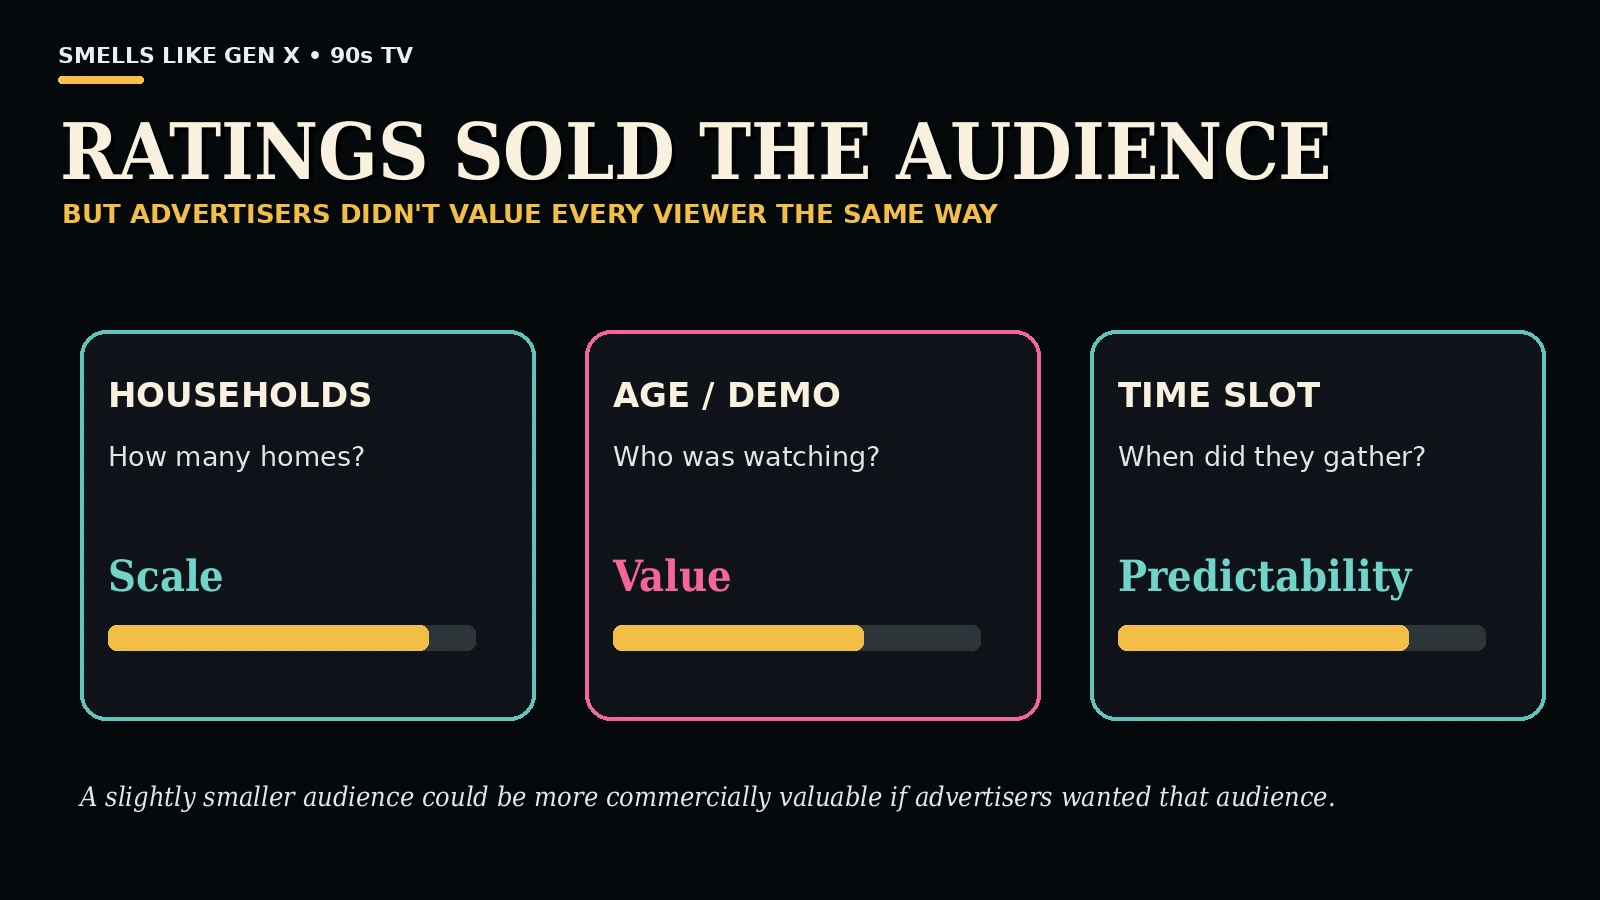
Total household size never told the whole business story. Advertisers cared intensely about age and other demographic groups, which meant a show could be more valuable than another program with a slightly larger but older audience. That logic helps explain why networks chased particular comedy and drama audiences even while shows like 60 Minutes remained enormous.
What has changed is not the existence of demographic targeting but the number of measurable alternatives. Modern campaigns can chase audiences across streaming platforms, social video, connected televisions and digital advertising. In the 90s, a top network series still offered something remarkably efficient: millions of people gathered in the same hour, measured by an industry-standard system, with commercial breaks everyone saw at roughly the same time.
The result was a strange combination of art and inventory. Networks wanted shows people loved, but they also wanted predictable blocks of attention they could sell. Ratings were the common language tying the creative side of television to the advertising side.
The End of the Monoculture Was a Long Fade
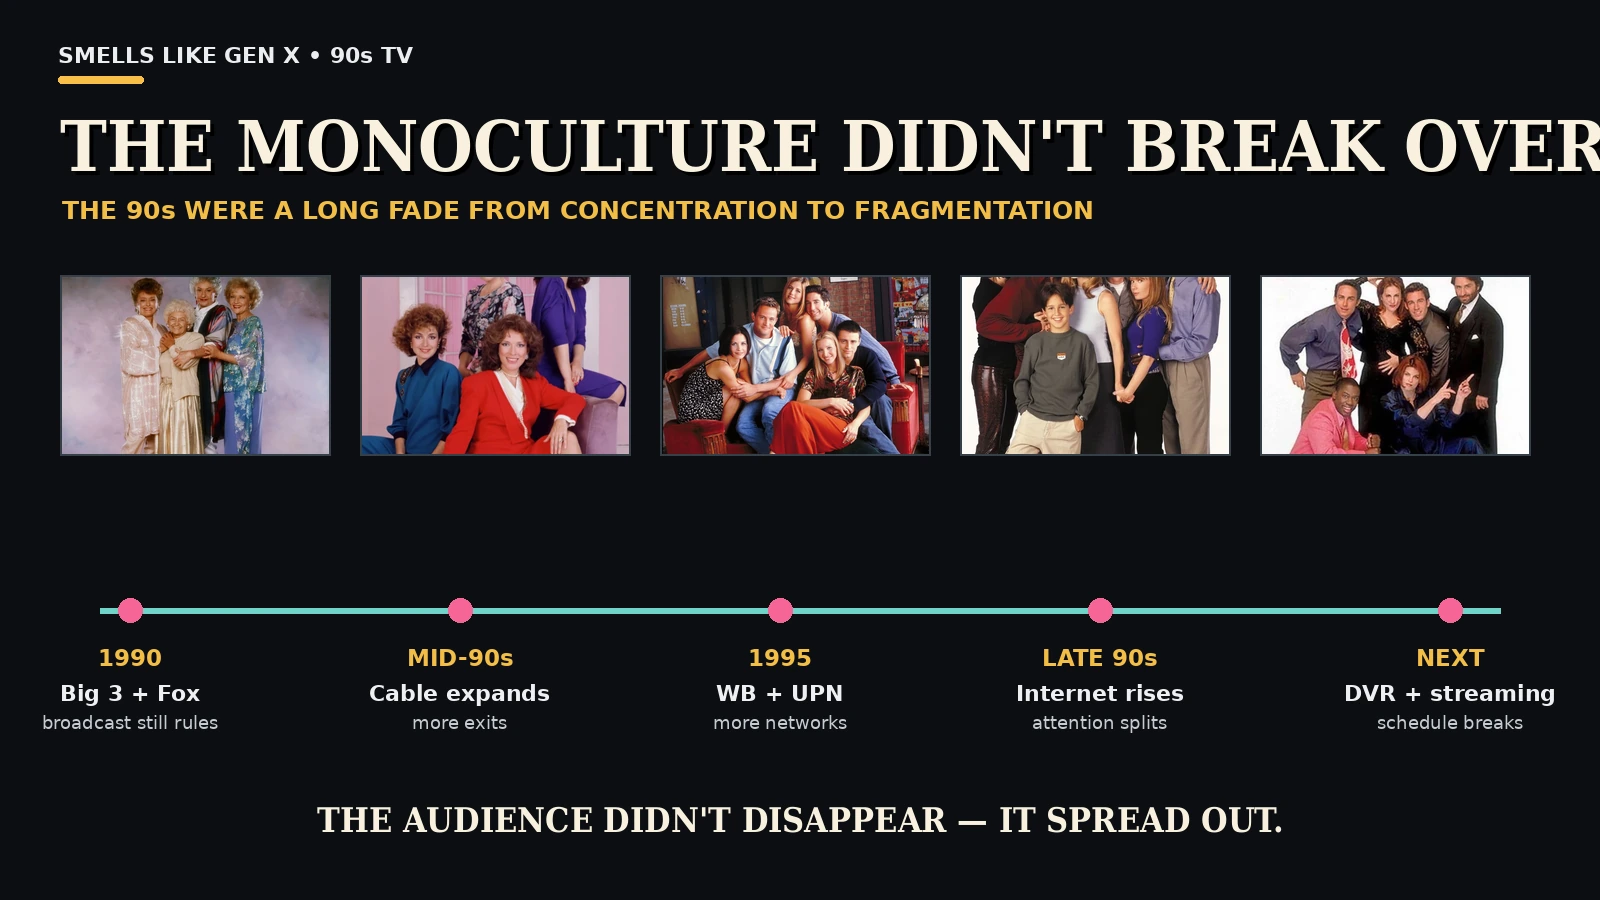
It is tempting to imagine a clean dividing line where old television ended and modern fragmentation began. The decade does not cooperate. Cable expanded all through the 90s. Fox became a full competitor. The WB and UPN added more choices. Home video kept growing. The internet began taking attention. And yet network hits continued to pull audiences that look gigantic by today’s standards.
That slow overlap is the point of our 1999 network-TV monoculture story. The old system was weakening before it disappeared. The ratings were still big because the infrastructure of mass viewing was still there; they were getting smaller because the audience had more exits every year. The 90s were not the last decade when Americans watched television. They were the last decade when the biggest television numbers still routinely looked like a census.
Once DVRs, broadband, streaming and personalized feeds arrived, the audience did not stop watching. It stopped agreeing on when and where to watch. That one change explains more about the collapse of old rating scale than any claim that people simply cared less about TV.
Why Context Matters More Than a Giant Nielsen Figure
A giant old rating can seduce us into thinking the number explains everything. It does not tell us whether people loved the program, whether they watched because the lead-in was strong, whether the audience was young or old, or whether the show would survive a time-slot move. It tells us that a measurable share of the television universe was there. That is powerful evidence, but it is evidence about attention, not affection. The distinction is why some enormous 90s hits now feel culturally faint while smaller shows developed obsessive followings that outlived them. Ratings are a map of behavior, not a ranking of artistic value.
The same caution applies when somebody posts a modern streaming total next to an old Nielsen household rating and declares that one era crushed the other. Streaming services can measure starts, hours, completion, unique accounts or global viewers; network ratings historically described a domestic television universe through a panel-based measurement system. Those are not interchangeable currencies. The interesting comparison is not “which number is bigger?” It is “what kind of audience behavior did this system reward?” The 90s rewarded concentration because the technology, schedule and distribution all pushed viewers toward the same limited set of choices at the same time.
That context also makes the old commercial break easier to understand. In a concentrated broadcast environment, a network could sell advertisers access to millions of people in one synchronized window. The audience might complain about the ads, use the bathroom, raid the refrigerator or channel-surf for two minutes, but the basic inventory was simple: this program, this hour, this audience. Modern advertising has more precision and more data, but the old network model had astonishing scale. A single successful series could become a platform for launching another show, selling national campaigns and anchoring an entire night of programming.
For Gen X, the memory of those numbers is really the memory of a shared system. We did not walk around quoting household ratings, but we knew when a show was everywhere. Teachers mentioned it. Radio hosts talked about it. Newspaper columnists assumed you had seen it. The rating was the statistical shadow cast by that experience. Once the audience fragmented, the shadow got smaller even when total television consumption remained enormous. That is the simplest answer to the whole question: the 90s numbers were bigger because the audience was gathered more tightly, not because later generations forgot how to watch TV.
Frequently asked questions
What is a Nielsen TV rating?
A rating is the percentage of the relevant TV population—historically often television households—that watched a program.
What is the difference between rating and share?
Rating uses the full television universe as the denominator. Share uses only the households or viewers actually using television at that time.
Why did 90s shows have such huge ratings?
Fewer major choices, heavy broadcast concentration, strong schedule habits and predominantly live viewing concentrated millions of people into the same programs.
Can you compare a 1990s household rating directly with today’s streaming viewers?
Not cleanly. The measurement systems, platforms, playback windows and denominators differ, so context matters.
Did cable already exist in the 1990s?
Absolutely. Cable was already a major force. The difference is that broadcast still controlled an unusually large share of mass prime-time attention.
Were VCR recordings included the way DVR playback is today?
Measurement evolved over time, but the modern array of Live+Same Day, Live+3 and Live+7 metrics reflects a far more normalized time-shifted environment than 1990s prime time.